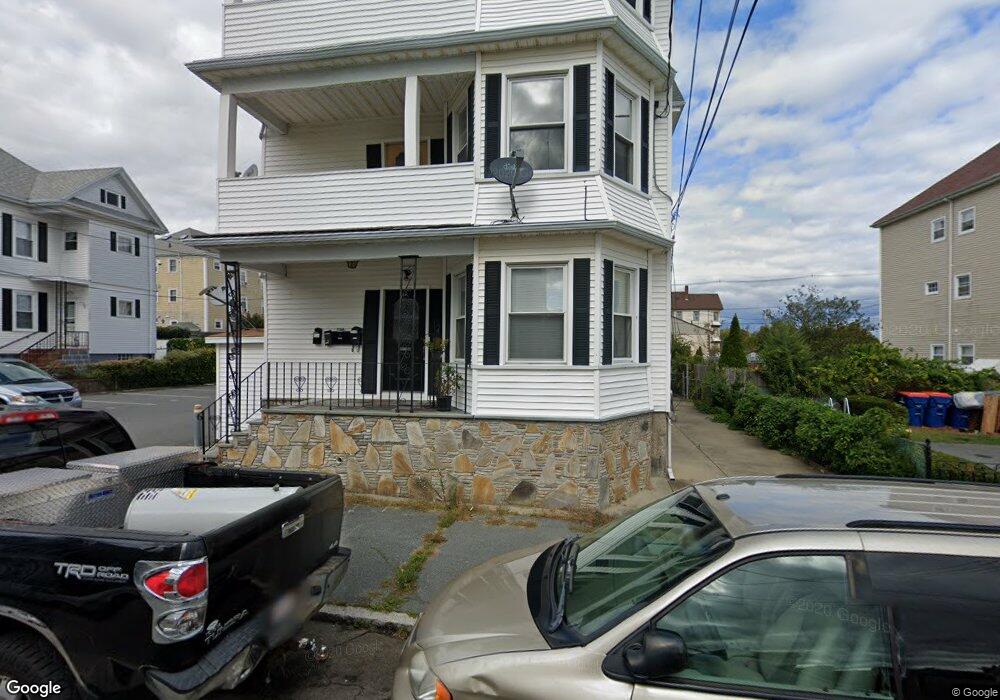
11 Sagamore St New Bedford, MA 02740
The South End NeighborhoodEstimated Value: $548,629 - $649,000
9
Beds
4
Baths
3,348
Sq Ft
$181/Sq Ft
Est. Value
About This Home
This home is located at 11 Sagamore St, New Bedford, MA 02740 and is currently estimated at $605,657, approximately $180 per square foot. 11 Sagamore St is a home located in Bristol County with nearby schools including John B. DeValles Elementary School, Roosevelt Middle School, and New Bedford High School.
Ownership History
Date
Name
Owned For
Owner Type
Purchase Details
Closed on
Feb 7, 2007
Sold by
Vertentes John
Bought by
Nvr Rt
Current Estimated Value
Purchase Details
Closed on
May 27, 1993
Sold by
Vertentes Joao R and Vertentes Maria A
Bought by
Vertentes John G and Vertentes Manuela F
Home Financials for this Owner
Home Financials are based on the most recent Mortgage that was taken out on this home.
Original Mortgage
$121,000
Interest Rate
7.41%
Mortgage Type
Purchase Money Mortgage
Create a Home Valuation Report for This Property
The Home Valuation Report is an in-depth analysis detailing your home's value as well as a comparison with similar homes in the area
Home Values in the Area
Average Home Value in this Area
Purchase History
| Date | Buyer | Sale Price | Title Company |
|---|---|---|---|
| Nvr Rt | $290,000 | -- | |
| Nvr Rt | $290,000 | -- | |
| Vertentes John G | $135,000 | -- | |
| Vertentes John G | $135,000 | -- |
Source: Public Records
Mortgage History
| Date | Status | Borrower | Loan Amount |
|---|---|---|---|
| Previous Owner | Vertentes John G | $269,500 | |
| Previous Owner | Vertentes John G | $111,000 | |
| Previous Owner | Vertentes John G | $121,000 |
Source: Public Records
Tax History Compared to Growth
Tax History
| Year | Tax Paid | Tax Assessment Tax Assessment Total Assessment is a certain percentage of the fair market value that is determined by local assessors to be the total taxable value of land and additions on the property. | Land | Improvement |
|---|---|---|---|---|
| 2025 | $5,972 | $528,000 | $104,600 | $423,400 |
| 2024 | $5,362 | $446,800 | $100,900 | $345,900 |
| 2023 | $4,976 | $348,200 | $84,400 | $263,800 |
| 2022 | $4,623 | $297,500 | $82,200 | $215,300 |
| 2021 | $4,467 | $286,500 | $78,500 | $208,000 |
| 2020 | $4,459 | $275,900 | $78,500 | $197,400 |
| 2019 | $3,897 | $236,600 | $78,500 | $158,100 |
| 2018 | $3,725 | $224,000 | $78,500 | $145,500 |
| 2017 | $3,505 | $210,000 | $80,300 | $129,700 |
| 2016 | $3,376 | $204,700 | $80,300 | $124,400 |
| 2015 | $3,157 | $200,700 | $80,300 | $120,400 |
| 2014 | $3,043 | $200,700 | $80,300 | $120,400 |
Source: Public Records
Map
Nearby Homes
- 19 Sagamore St
- 353 Bolton St
- 26 Sidney St
- 14 Sidney St
- 14 Sidney St Unit 3
- 14 Sidney St Unit 2
- 355 Bolton St
- 25 Sagamore St
- 28 Sidney St
- 14 Sagamore St
- 18 Sagamore St
- 22 Sagamore St
- 33 Sagamore St
- 33 Sagamore St Unit 2
- 30 Sidney St
- 345 Bolton St
- 32 Sagamore St
- 32 Sidney St
- 17 Sidney St
- 17 Jenkins St