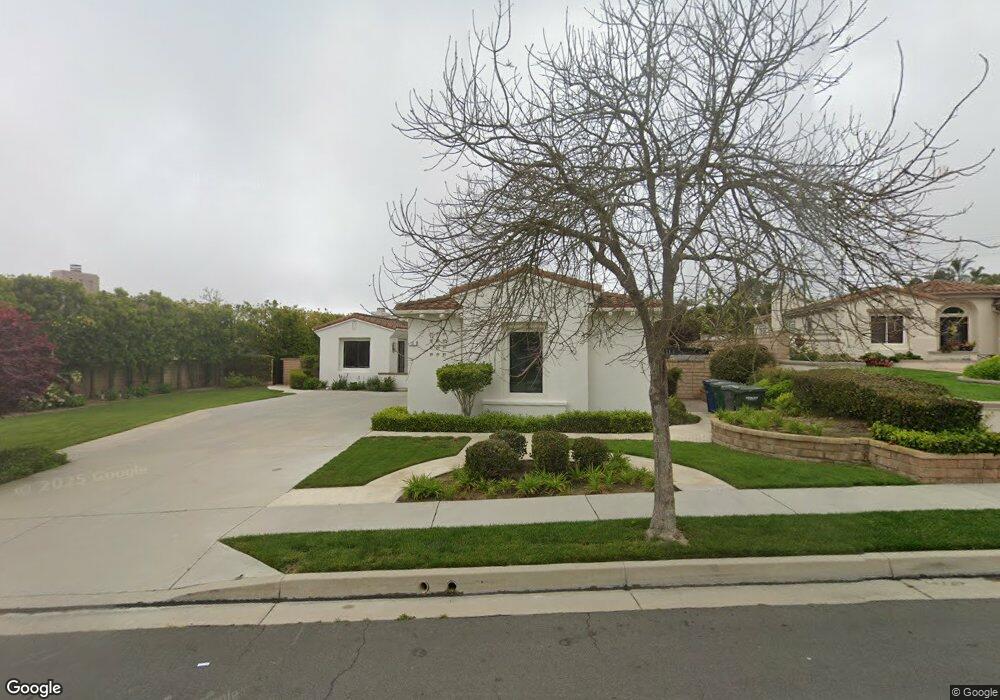
11 Sail View Ave Rancho Palos Verdes, CA 90275
Estimated Value: $2,861,498 - $3,441,000
4
Beds
4
Baths
3,643
Sq Ft
$865/Sq Ft
Est. Value
About This Home
This home is located at 11 Sail View Ave, Rancho Palos Verdes, CA 90275 and is currently estimated at $3,152,875, approximately $865 per square foot. 11 Sail View Ave is a home located in Los Angeles County with nearby schools including Vista Grande Elementary, Ridgecrest Intermediate, and Palos Verdes Peninsula High School.
Ownership History
Date
Name
Owned For
Owner Type
Purchase Details
Closed on
Oct 25, 2018
Sold by
Tong Anli L
Bought by
Tong Anli L and The Anli L Tong Living Trust
Current Estimated Value
Purchase Details
Closed on
Jul 1, 2013
Sold by
Tong Anli L
Bought by
Tong Anli L
Home Financials for this Owner
Home Financials are based on the most recent Mortgage that was taken out on this home.
Original Mortgage
$625,500
Outstanding Balance
$435,995
Interest Rate
3.12%
Mortgage Type
New Conventional
Estimated Equity
$2,716,880
Purchase Details
Closed on
Jun 18, 2013
Sold by
Tong Teddy Y and Tong Anli L
Bought by
Tong Anli L
Home Financials for this Owner
Home Financials are based on the most recent Mortgage that was taken out on this home.
Original Mortgage
$625,500
Outstanding Balance
$435,995
Interest Rate
3.12%
Mortgage Type
New Conventional
Estimated Equity
$2,716,880
Purchase Details
Closed on
Apr 5, 1999
Sold by
Rancho Palos Verdes Villas Llc
Bought by
Tong Teddy Y and Tong Anli Lin
Home Financials for this Owner
Home Financials are based on the most recent Mortgage that was taken out on this home.
Original Mortgage
$650,000
Interest Rate
7.37%
Create a Home Valuation Report for This Property
The Home Valuation Report is an in-depth analysis detailing your home's value as well as a comparison with similar homes in the area
Home Values in the Area
Average Home Value in this Area
Purchase History
| Date | Buyer | Sale Price | Title Company |
|---|---|---|---|
| Tong Anli L | -- | None Available | |
| Tong Anli L | -- | None Available | |
| Tong Anli L | -- | None Available | |
| Tong Teddy Y | $865,000 | First American Title Co |
Source: Public Records
Mortgage History
| Date | Status | Borrower | Loan Amount |
|---|---|---|---|
| Open | Tong Anli L | $625,500 | |
| Previous Owner | Tong Teddy Y | $650,000 | |
| Closed | Tong Teddy Y | $128,350 |
Source: Public Records
Tax History Compared to Growth
Tax History
| Year | Tax Paid | Tax Assessment Tax Assessment Total Assessment is a certain percentage of the fair market value that is determined by local assessors to be the total taxable value of land and additions on the property. | Land | Improvement |
|---|---|---|---|---|
| 2025 | $28,413 | $2,435,470 | $1,948,377 | $487,093 |
| 2024 | $27,281 | $2,387,717 | $1,910,174 | $477,543 |
| 2023 | $26,807 | $2,340,900 | $1,872,720 | $468,180 |
| 2022 | $25,443 | $2,295,000 | $1,836,000 | $459,000 |
| 2021 | $14,514 | $1,243,759 | $660,262 | $583,497 |
| 2020 | $8,657 | $1,231,006 | $653,492 | $577,514 |
| 2019 | $13,886 | $1,206,870 | $640,679 | $566,191 |
| 2018 | $13,655 | $1,183,207 | $628,117 | $555,090 |
| 2016 | $12,955 | $1,137,263 | $603,727 | $533,536 |
| 2015 | $12,962 | $1,120,181 | $594,659 | $525,522 |
| 2014 | $12,787 | $1,098,239 | $583,011 | $515,228 |
Source: Public Records
Map
Nearby Homes
- 23 Country Meadow Rd
- 40 Santa Catalina Dr
- 5726 Sunmist Dr
- 23 Quarterhorse Ln
- 48 Santa Cruz
- 37 Santa Cruz
- 54 Cresta Verde Dr
- 84 Cresta Verde Dr
- 71 Cresta Verde Dr
- 21 Santa Catalina Dr
- 30221 Matisse Dr
- 30538 Rhone Dr
- 29 Santa Barbara Dr
- 43 Country Ln
- 29600 Island View Dr Unit 201
- 29600 Island View Dr Unit 300
- 6526 Ocean Crest Dr
- 29707 Island View Dr Unit 14
- 5567 Mistridge Dr
- 0 Rhone Dr
- 15 Sail View Ave
- 9 Sail View Ave
- 17 Sail View Ave
- 7 Sail View Ave
- 50 Sea Breeze Ave
- 52 Sea Breeze Ave
- 8 Sail View Ave
- 48 Sea Breeze Ave
- 10 Sail View Ave
- 21 Sail View Ave
- 5 Sail View Ave
- 54 Sea Breeze Ave
- 6 Sail View Ave
- 12 Sail View Ave
- 16 Sail View Ave
- 27 Sail View Ave
- 56 Sea Breeze Ave
- 18 Sail View Ave
- 3 Sail View Ave
- 2 Sail View Ave