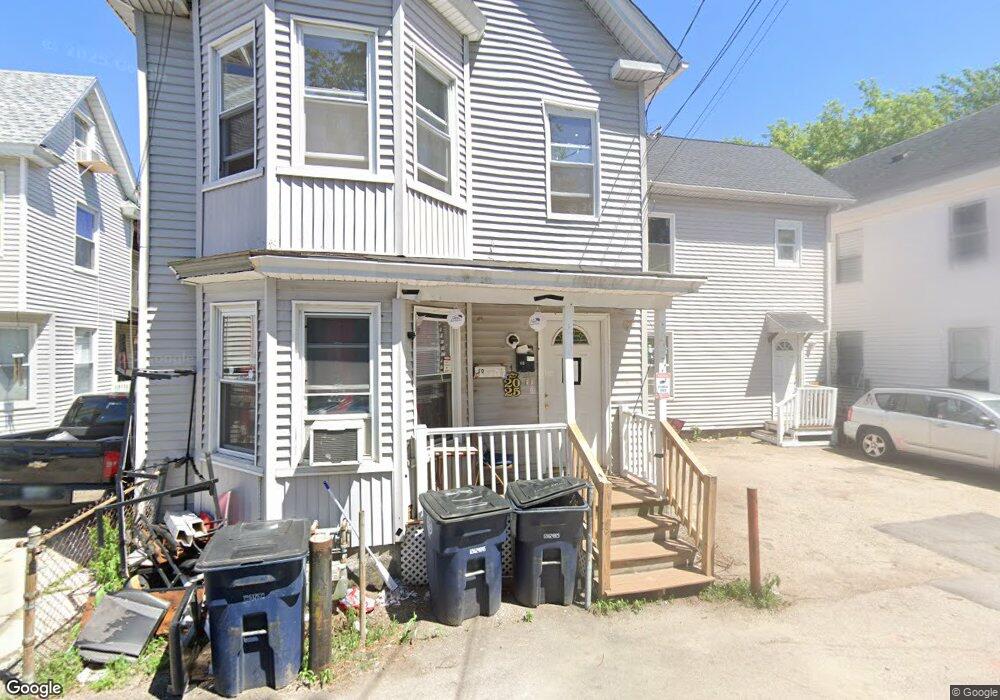
11 Salem St Rr 320 Unit 2nd Fl Nashua, NH 03060
North End Nashua NeighborhoodEstimated Value: $402,351 - $519,000
3
Beds
1
Bath
1,037
Sq Ft
$451/Sq Ft
Est. Value
About This Home
This home is located at 11 Salem St Rr 320 Unit 2nd Fl, Nashua, NH 03060 and is currently estimated at $467,588, approximately $450 per square foot. 11 Salem St Rr 320 Unit 2nd Fl is a home located in Hillsborough County with nearby schools including Mount Pleasant Elementary School, Pennichuck Middle School, and Nashua High School North.
Ownership History
Date
Name
Owned For
Owner Type
Purchase Details
Closed on
Sep 2, 2008
Sold by
Us Bank Na
Bought by
11 Salem Street Llc
Current Estimated Value
Purchase Details
Closed on
Jan 22, 2008
Sold by
White John J and Us Bank Na
Bought by
Us Bank Na
Purchase Details
Closed on
Aug 2, 2005
Sold by
Digesse Walter J
Bought by
White John J and White Joan H
Home Financials for this Owner
Home Financials are based on the most recent Mortgage that was taken out on this home.
Original Mortgage
$225,000
Interest Rate
5.67%
Mortgage Type
Purchase Money Mortgage
Purchase Details
Closed on
Jun 14, 1999
Sold by
Jenkins Thomas L and Jenkins Judith
Bought by
Digesse Walter J and Digesse Lisa M
Home Financials for this Owner
Home Financials are based on the most recent Mortgage that was taken out on this home.
Original Mortgage
$71,900
Interest Rate
6.9%
Mortgage Type
Purchase Money Mortgage
Create a Home Valuation Report for This Property
The Home Valuation Report is an in-depth analysis detailing your home's value as well as a comparison with similar homes in the area
Home Values in the Area
Average Home Value in this Area
Purchase History
| Date | Buyer | Sale Price | Title Company |
|---|---|---|---|
| 11 Salem Street Llc | $87,000 | -- | |
| Us Bank Na | $241,400 | -- | |
| White John J | $250,000 | -- | |
| Digesse Walter J | $79,900 | -- |
Source: Public Records
Mortgage History
| Date | Status | Borrower | Loan Amount |
|---|---|---|---|
| Open | Digesse Walter J | $119,250 | |
| Closed | Digesse Walter J | $150,000 | |
| Previous Owner | Digesse Walter J | $225,000 | |
| Previous Owner | Digesse Walter J | $71,900 |
Source: Public Records
Tax History Compared to Growth
Tax History
| Year | Tax Paid | Tax Assessment Tax Assessment Total Assessment is a certain percentage of the fair market value that is determined by local assessors to be the total taxable value of land and additions on the property. | Land | Improvement |
|---|---|---|---|---|
| 2024 | $6,570 | $413,200 | $101,600 | $311,600 |
| 2023 | $6,096 | $334,400 | $81,300 | $253,100 |
| 2022 | $6,043 | $334,400 | $81,300 | $253,100 |
| 2021 | $4,897 | $210,900 | $54,200 | $156,700 |
| 2020 | $4,768 | $210,900 | $54,200 | $156,700 |
| 2019 | $4,589 | $210,900 | $54,200 | $156,700 |
| 2018 | $4,473 | $210,900 | $54,200 | $156,700 |
| 2017 | $4,441 | $172,200 | $65,300 | $106,900 |
| 2016 | $4,317 | $172,200 | $65,300 | $106,900 |
| 2015 | $4,224 | $172,200 | $65,300 | $106,900 |
| 2014 | $4,141 | $172,200 | $65,300 | $106,900 |
Source: Public Records
Map
Nearby Homes
- 13 Sapphire Ln
- 15 Atherton Ave
- 19 Atherton Ave
- 36-38 Courtland St
- 71 Concord St
- 18 Harbor Ave Unit 208
- 11 Charles St
- 13 Mulvanity St
- 5 Mulberry St
- 21 Edson St
- 4 Chase St
- 4 Reservoir St
- 61 Manchester St
- 38 Central St
- 24 E Otterson St
- 8 Buck St Unit 10
- 0 Baldwin St
- 30 Ledge St
- 73 Berkeley St
- 19 Bartlett Ave