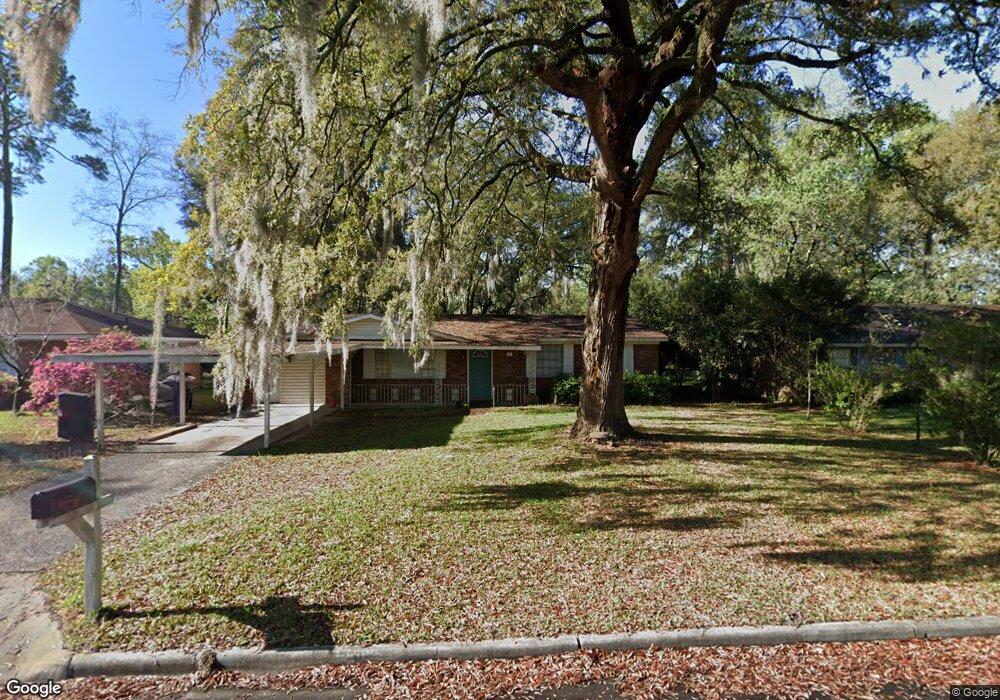
11 San Fernando Blvd Savannah, GA 31419
Wilshire Estates NeighborhoodEstimated Value: $294,000 - $320,000
4
Beds
2
Baths
1,749
Sq Ft
$176/Sq Ft
Est. Value
About This Home
This home is located at 11 San Fernando Blvd, Savannah, GA 31419 and is currently estimated at $308,436, approximately $176 per square foot. 11 San Fernando Blvd is a home located in Chatham County with nearby schools including Largo-Tibet Elementary School, Windsor Forest High School, and Southwest Middle School.
Ownership History
Date
Name
Owned For
Owner Type
Purchase Details
Closed on
May 28, 2025
Sold by
Catamount Properties 2018 Llc
Bought by
Ayona Yonder Alfredo Carrill and Laporta Luis Vera
Current Estimated Value
Home Financials for this Owner
Home Financials are based on the most recent Mortgage that was taken out on this home.
Original Mortgage
$303,753
Outstanding Balance
$302,966
Interest Rate
6.76%
Mortgage Type
New Conventional
Estimated Equity
$5,470
Purchase Details
Closed on
Feb 6, 2024
Sold by
Bussie Marvin K
Bought by
Catamount Properties 2018 Llc
Purchase Details
Closed on
Dec 2, 2015
Sold by
Southern Living Inc
Bought by
Bussie Marvin K
Home Financials for this Owner
Home Financials are based on the most recent Mortgage that was taken out on this home.
Original Mortgage
$122,550
Interest Rate
3.91%
Mortgage Type
New Conventional
Purchase Details
Closed on
Jul 9, 2015
Sold by
Deutsche Bank National Trust Co Trustee
Bought by
Southern Living Inc
Purchase Details
Closed on
May 22, 2007
Sold by
Not Provided
Bought by
Deutsche Bank Natl Trust Co
Create a Home Valuation Report for This Property
The Home Valuation Report is an in-depth analysis detailing your home's value as well as a comparison with similar homes in the area
Home Values in the Area
Average Home Value in this Area
Purchase History
| Date | Buyer | Sale Price | Title Company |
|---|---|---|---|
| Ayona Yonder Alfredo Carrill | $313,350 | -- | |
| Catamount Properties 2018 Llc | $209,000 | -- | |
| Bussie Marvin K | $129,900 | -- | |
| Southern Living Inc | $76,584 | -- | |
| Deutsche Bank Natl Trust Co | -- | -- |
Source: Public Records
Mortgage History
| Date | Status | Borrower | Loan Amount |
|---|---|---|---|
| Open | Ayona Yonder Alfredo Carrill | $303,753 | |
| Previous Owner | Bussie Marvin K | $122,550 |
Source: Public Records
Tax History Compared to Growth
Tax History
| Year | Tax Paid | Tax Assessment Tax Assessment Total Assessment is a certain percentage of the fair market value that is determined by local assessors to be the total taxable value of land and additions on the property. | Land | Improvement |
|---|---|---|---|---|
| 2025 | $4,967 | $101,960 | $20,000 | $81,960 |
| 2024 | $4,967 | $85,480 | $20,000 | $65,480 |
| 2023 | $959 | $78,640 | $14,000 | $64,640 |
| 2022 | $825 | $67,600 | $9,200 | $58,400 |
| 2021 | $2,766 | $60,000 | $9,200 | $50,800 |
| 2020 | $1,461 | $48,960 | $9,200 | $39,760 |
| 2019 | $2,056 | $46,280 | $9,200 | $37,080 |
| 2018 | $2,047 | $45,520 | $9,200 | $36,320 |
| 2017 | $1,243 | $42,400 | $9,200 | $33,200 |
| 2016 | $1,118 | $38,320 | $9,200 | $29,120 |
| 2015 | $1,633 | $39,160 | $9,200 | $29,960 |
| 2014 | $2,027 | $36,560 | $0 | $0 |
Source: Public Records
Map
Nearby Homes
- 3 Monica Blvd
- 35 Stetson Dr
- 236 W Magnolia Ave
- 310 Tibet Ave Unit 24
- 310 Tibet Ave Unit 52
- 400 Tibet Ave Unit 16
- 400 Tibet Ave Unit 39
- 202 Leeds Gate Rd
- 11304 Largo Dr
- 202 Sunderland Dr
- 10710 Egmont Rd Unit 19
- 11405 Largo Dr
- 1 Lewis Dr
- 618 Tibet Ave
- 11401 Willis Dr
- 4 Dorchester Ct
- 706 Tibet Ave
- 11 Skyline Dr
- 12204 Deerfield Rd
- 10524 Gray Fox Way
- 13 San Fernando Blvd
- 9 San Fernando Blvd
- 15 San Fernando Blvd
- 7 San Fernando Blvd
- 10 San Fernando Blvd
- 12 San Fernando Blvd
- 14 Monica Blvd
- 12 Monica Blvd
- 16 Monica Blvd
- 14 San Fernando Blvd
- 8 San Fernando Blvd
- 5 San Fernando Blvd
- 10 Monica Blvd
- 17 San Fernando Blvd
- 18 Monica Blvd
- 6 San Fernando Blvd
- 20 Monica Blvd
- 16 San Fernando Blvd
- 8 Monica Blvd
- 19 San Fernando Blvd