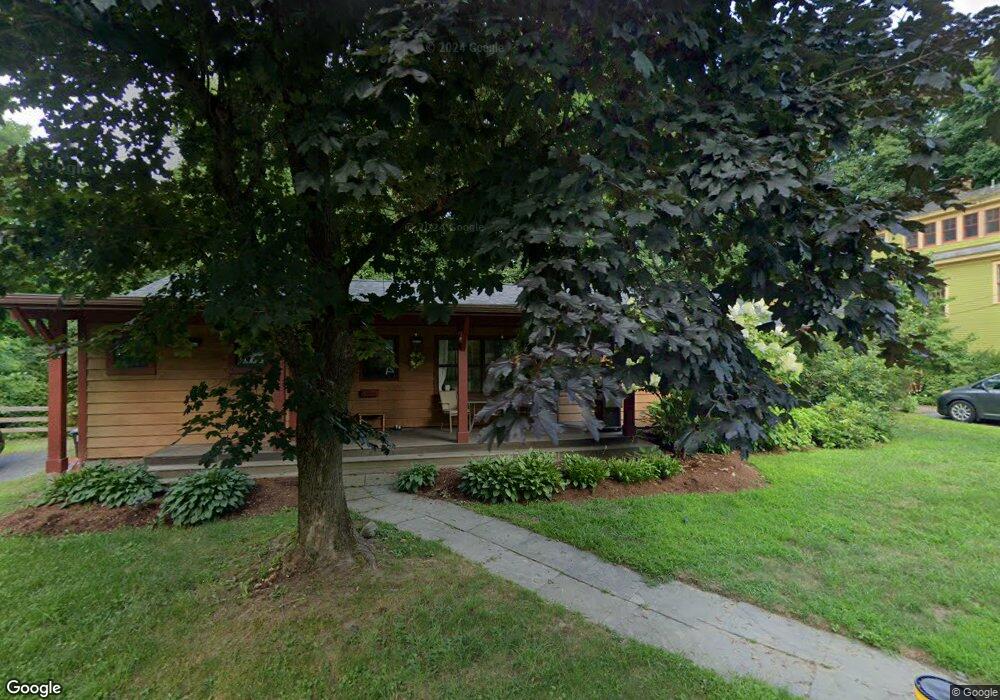
11 Sargent St Hanover, NH 03755
Estimated Value: $944,294 - $1,151,000
4
Beds
3
Baths
1,398
Sq Ft
$738/Sq Ft
Est. Value
About This Home
This home is located at 11 Sargent St, Hanover, NH 03755 and is currently estimated at $1,031,824, approximately $738 per square foot. 11 Sargent St is a home located in Grafton County with nearby schools including Bernice A. Ray School, Frances C. Richmond School, and Hanover High School.
Ownership History
Date
Name
Owned For
Owner Type
Purchase Details
Closed on
Jan 12, 2016
Sold by
Soderquist Christopher
Bought by
Soderquist Jane E
Current Estimated Value
Purchase Details
Closed on
Aug 28, 2000
Sold by
Pease David L and Pease Lisa M
Bought by
Soderquist Jane E and Soderquist Christopher
Create a Home Valuation Report for This Property
The Home Valuation Report is an in-depth analysis detailing your home's value as well as a comparison with similar homes in the area
Home Values in the Area
Average Home Value in this Area
Purchase History
| Date | Buyer | Sale Price | Title Company |
|---|---|---|---|
| Soderquist Jane E | -- | -- | |
| Soderquist Jane E | $190,000 | -- | |
| Soderquist Jane E | -- | -- | |
| Soderquist Jane E | $190,000 | -- |
Source: Public Records
Mortgage History
| Date | Status | Borrower | Loan Amount |
|---|---|---|---|
| Closed | Soderquist Jane E | $56,125 | |
| Previous Owner | Soderquist Jane E | $346,000 | |
| Previous Owner | Soderquist Jane E | $124,500 |
Source: Public Records
Tax History Compared to Growth
Tax History
| Year | Tax Paid | Tax Assessment Tax Assessment Total Assessment is a certain percentage of the fair market value that is determined by local assessors to be the total taxable value of land and additions on the property. | Land | Improvement |
|---|---|---|---|---|
| 2024 | $13,406 | $695,700 | $410,000 | $285,700 |
| 2023 | $12,898 | $695,700 | $410,000 | $285,700 |
| 2022 | $12,377 | $695,700 | $410,000 | $285,700 |
| 2021 | $12,272 | $695,700 | $410,000 | $285,700 |
| 2020 | $11,934 | $590,500 | $403,200 | $187,300 |
| 2019 | $11,769 | $590,500 | $403,200 | $187,300 |
| 2018 | $11,355 | $590,500 | $403,200 | $187,300 |
| 2017 | $9,730 | $448,600 | $218,200 | $230,400 |
| 2016 | $9,551 | $448,600 | $218,200 | $230,400 |
| 2015 | $9,367 | $448,600 | $218,200 | $230,400 |
| 2014 | $8,985 | $448,600 | $218,200 | $230,400 |
| 2013 | $8,662 | $448,600 | $218,200 | $230,400 |
| 2012 | $8,343 | $451,200 | $217,400 | $233,800 |
Source: Public Records
Map
Nearby Homes