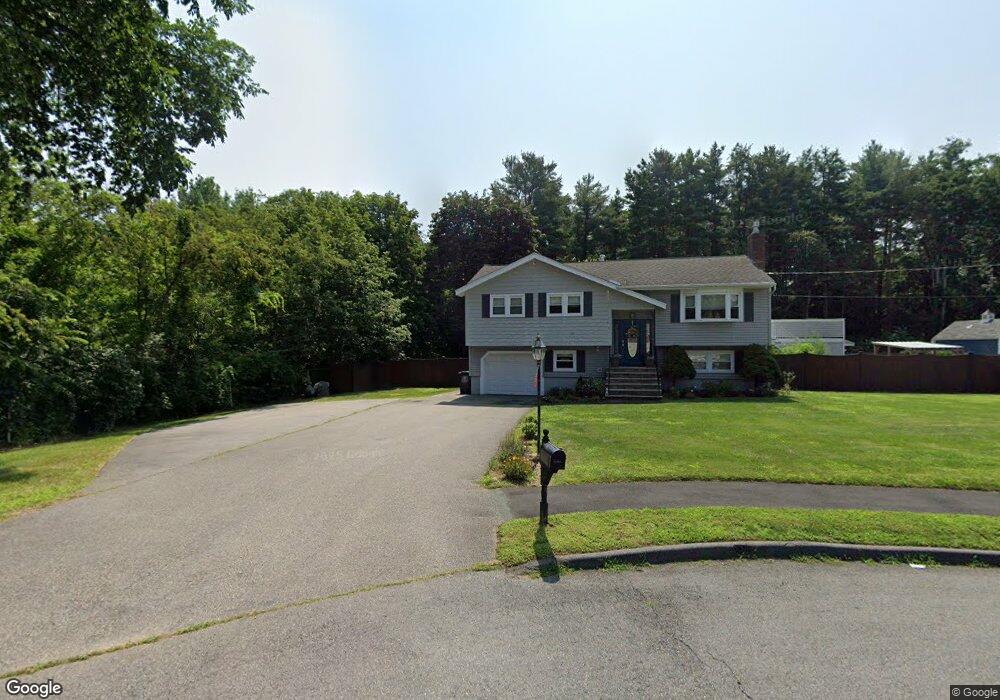
11 Sherburn Place Wilmington, MA 01887
Estimated Value: $725,000 - $856,000
3
Beds
2
Baths
1,164
Sq Ft
$679/Sq Ft
Est. Value
About This Home
This home is located at 11 Sherburn Place, Wilmington, MA 01887 and is currently estimated at $790,445, approximately $679 per square foot. 11 Sherburn Place is a home located in Middlesex County with nearby schools including Wilmington Middle School, Wilmington High School, and Abundant Life Christian School and Childcare.
Ownership History
Date
Name
Owned For
Owner Type
Purchase Details
Closed on
Jul 26, 2022
Sold by
Foley John and Floyd-Foley Melanie
Bought by
Foley Ft and Foley
Current Estimated Value
Home Financials for this Owner
Home Financials are based on the most recent Mortgage that was taken out on this home.
Original Mortgage
$538,000
Outstanding Balance
$511,731
Interest Rate
5.23%
Mortgage Type
Purchase Money Mortgage
Estimated Equity
$278,714
Purchase Details
Closed on
Feb 1, 1999
Sold by
Hawes Kenneth R and Hawes Tammy L
Bought by
Foley John and Floyd-Foley Melanie
Home Financials for this Owner
Home Financials are based on the most recent Mortgage that was taken out on this home.
Original Mortgage
$174,900
Interest Rate
6.67%
Mortgage Type
Purchase Money Mortgage
Purchase Details
Closed on
Jun 24, 1996
Sold by
Cunio Robert W and Cunio Mary R
Bought by
Hawes Kenneth R and Hawes Tammy L
Create a Home Valuation Report for This Property
The Home Valuation Report is an in-depth analysis detailing your home's value as well as a comparison with similar homes in the area
Home Values in the Area
Average Home Value in this Area
Purchase History
| Date | Buyer | Sale Price | Title Company |
|---|---|---|---|
| Foley Ft | $794,000 | None Available | |
| Foley John | $234,900 | -- | |
| Hawes Kenneth R | $198,000 | -- |
Source: Public Records
Mortgage History
| Date | Status | Borrower | Loan Amount |
|---|---|---|---|
| Open | Foley Ft | $538,000 | |
| Previous Owner | Hawes Kenneth R | $300,000 | |
| Previous Owner | Hawes Kenneth R | $100,000 | |
| Previous Owner | Hawes Kenneth R | $174,900 |
Source: Public Records
Tax History Compared to Growth
Tax History
| Year | Tax Paid | Tax Assessment Tax Assessment Total Assessment is a certain percentage of the fair market value that is determined by local assessors to be the total taxable value of land and additions on the property. | Land | Improvement |
|---|---|---|---|---|
| 2025 | $7,546 | $659,000 | $334,000 | $325,000 |
| 2024 | $7,482 | $654,600 | $334,000 | $320,600 |
| 2023 | $7,226 | $605,200 | $303,500 | $301,700 |
| 2022 | $6,866 | $526,900 | $253,000 | $273,900 |
| 2021 | $6,952 | $502,300 | $229,900 | $272,400 |
| 2020 | $6,996 | $515,200 | $229,900 | $285,300 |
| 2019 | $6,467 | $470,300 | $219,000 | $251,300 |
| 2018 | $5,997 | $422,800 | $208,600 | $214,200 |
| 2017 | $5,997 | $415,000 | $208,600 | $206,400 |
| 2016 | $5,697 | $389,400 | $198,600 | $190,800 |
| 2015 | $5,439 | $378,500 | $198,600 | $179,900 |
| 2014 | $5,122 | $359,700 | $189,100 | $170,600 |
Source: Public Records
Map
Nearby Homes