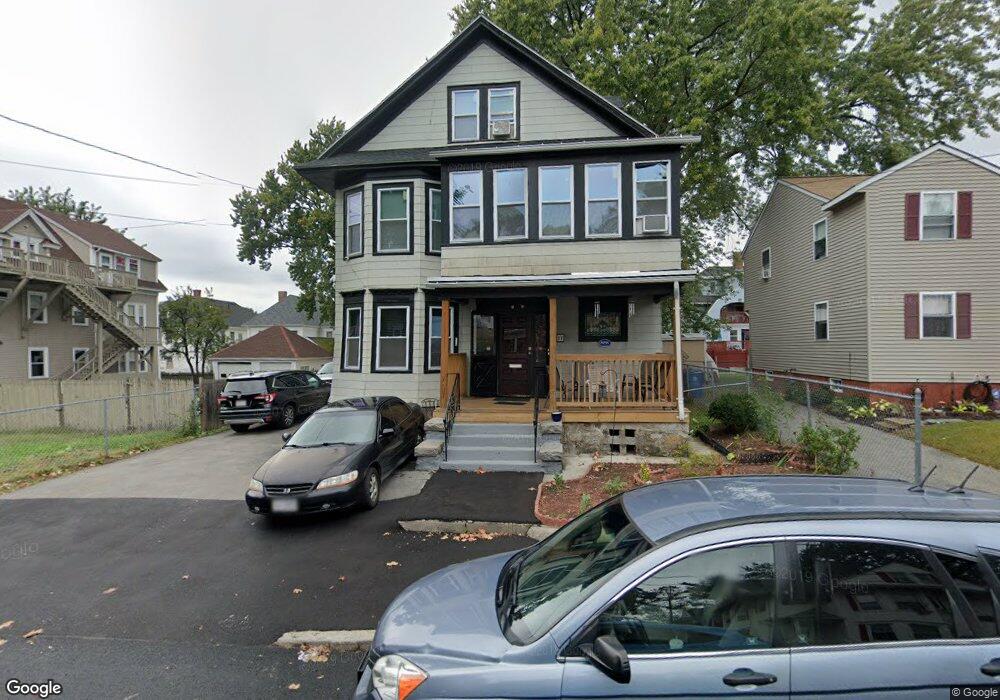
11 Sheridan St Lawrence, MA 01841
Prospect Hill-Back Bay NeighborhoodEstimated Value: $729,463 - $848,000
8
Beds
3
Baths
3,165
Sq Ft
$246/Sq Ft
Est. Value
About This Home
This home is located at 11 Sheridan St, Lawrence, MA 01841 and is currently estimated at $778,616, approximately $246 per square foot. 11 Sheridan St is a home located in Essex County with nearby schools including Olive Branch Elementary School, James F. Hennessey School, and School For Exceptional Studies.
Ownership History
Date
Name
Owned For
Owner Type
Purchase Details
Closed on
Sep 14, 2015
Sold by
Torres Doris
Bought by
Fernandez Luis A
Current Estimated Value
Home Financials for this Owner
Home Financials are based on the most recent Mortgage that was taken out on this home.
Original Mortgage
$312,240
Outstanding Balance
$249,269
Interest Rate
4.4%
Mortgage Type
FHA
Estimated Equity
$529,347
Purchase Details
Closed on
Apr 26, 2010
Sold by
Kelley Martha A
Bought by
Torres Doris C
Home Financials for this Owner
Home Financials are based on the most recent Mortgage that was taken out on this home.
Original Mortgage
$203,250
Interest Rate
5.5%
Mortgage Type
FHA
Purchase Details
Closed on
Jul 22, 2004
Sold by
Ann Sheehan Rt
Bought by
Kelley Martha A
Create a Home Valuation Report for This Property
The Home Valuation Report is an in-depth analysis detailing your home's value as well as a comparison with similar homes in the area
Home Values in the Area
Average Home Value in this Area
Purchase History
| Date | Buyer | Sale Price | Title Company |
|---|---|---|---|
| Fernandez Luis A | $318,000 | -- | |
| Torres Doris C | $207,000 | -- | |
| Kelley Martha A | -- | -- |
Source: Public Records
Mortgage History
| Date | Status | Borrower | Loan Amount |
|---|---|---|---|
| Open | Fernandez Luis A | $312,240 | |
| Previous Owner | Torres Doris C | $203,250 |
Source: Public Records
Tax History Compared to Growth
Tax History
| Year | Tax Paid | Tax Assessment Tax Assessment Total Assessment is a certain percentage of the fair market value that is determined by local assessors to be the total taxable value of land and additions on the property. | Land | Improvement |
|---|---|---|---|---|
| 2025 | $5,898 | $670,200 | $139,500 | $530,700 |
| 2024 | $5,340 | $577,300 | $103,100 | $474,200 |
| 2023 | $5,631 | $554,200 | $100,600 | $453,600 |
| 2022 | $5,353 | $467,900 | $100,600 | $367,300 |
| 2021 | $5,209 | $424,500 | $100,600 | $323,900 |
| 2020 | $5,124 | $412,200 | $90,400 | $321,800 |
| 2019 | $4,591 | $335,600 | $81,300 | $254,300 |
| 2018 | $4,189 | $292,500 | $69,900 | $222,600 |
| 2017 | $3,981 | $259,500 | $69,100 | $190,400 |
| 2016 | $3,660 | $236,000 | $50,400 | $185,600 |
| 2015 | $3,638 | $240,600 | $50,400 | $190,200 |
Source: Public Records
Map
Nearby Homes
- 20 Knox St Unit 43
- 20 Knox St Unit 23
- 100-102 E Haverhill St
- 35 Kendall St
- 167 Ferry 53 Mann St Unit 2,5,6
- 24 Boylston St
- 65 Brook St
- 9 Boylston St
- 35 Swan Ave
- 192 Union St
- 24 Court St
- 15 Swan Ave
- 6 Longwood Dr
- 68 Wesley St
- 129-131 Lexington St
- 169 Berkeley St
- 6 Brook St
- 183 Berkeley St
- 7 Magnolia Rd
- 106 Leroy Ave
- 9 Sheridan St
- 12 Logan St
- 10 Sheridan St
- 5-7 Sheridan St
- 16 Logan St
- 68 Sheridan St
- 6-8 Sheridan St
- 10 Sheridan St
- 7 Sheridan St Unit 2
- 5 Sheridan St Unit 2
- 25 Sheridan St
- 25 Sheridan St Unit 1
- 8 Logan St Unit 10
- 18 Logan St Unit 20
- 384 Prospect St
- 384 Prospect St Unit 2
- 22 Logan St Unit 24
- 352 Prospect St
- 14-16 Sheridan St
- 14 Sheridan St Unit 16