Estimated Value: $539,000 - $556,000
4
Beds
3
Baths
2,339
Sq Ft
$233/Sq Ft
Est. Value
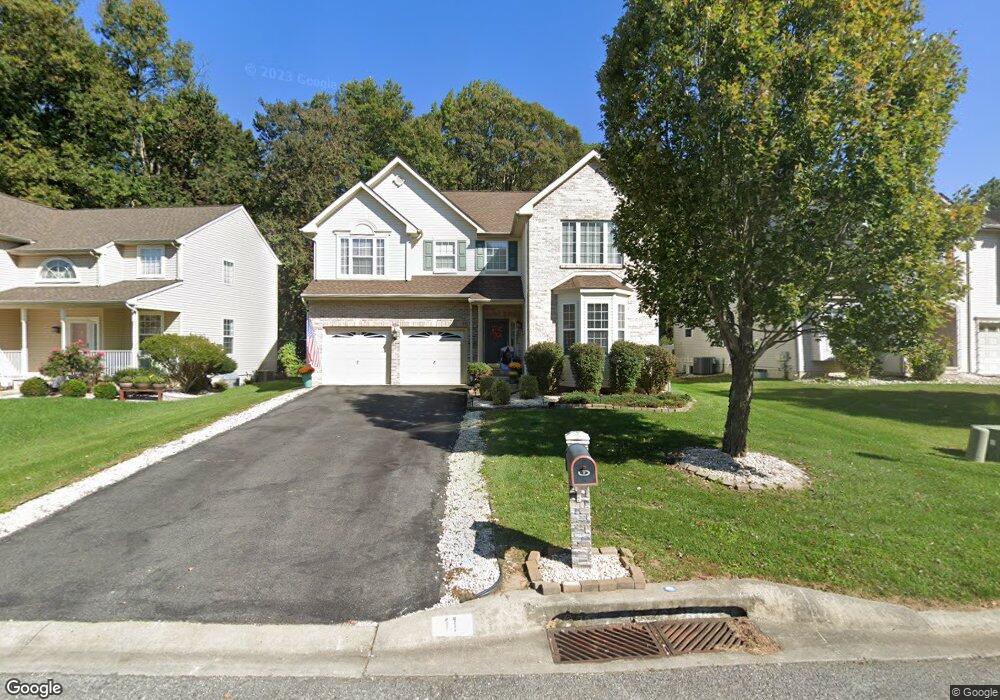
About This Home
This home is located at 11 Sherie St, Bear, DE 19701 and is currently estimated at $544,382, approximately $232 per square foot. 11 Sherie St is a home located in New Castle County with nearby schools including Olive B. Loss Elementary School, Alfred G. Waters Middle School, and Appoquinimink High School.
Ownership History
Date
Name
Owned For
Owner Type
Purchase Details
Closed on
Oct 14, 2009
Sold by
Marsh Joy T and Marsh Marcus K
Bought by
Marsh Joy T and Marsh Marcus K
Current Estimated Value
Home Financials for this Owner
Home Financials are based on the most recent Mortgage that was taken out on this home.
Original Mortgage
$300,833
Outstanding Balance
$197,040
Interest Rate
5.14%
Mortgage Type
New Conventional
Estimated Equity
$347,342
Purchase Details
Closed on
Jul 14, 2006
Sold by
Fuhrer Martin A
Bought by
Marsh Marcus K and Tokarski Joy
Home Financials for this Owner
Home Financials are based on the most recent Mortgage that was taken out on this home.
Original Mortgage
$295,920
Interest Rate
6.62%
Mortgage Type
Purchase Money Mortgage
Purchase Details
Closed on
Jun 27, 2003
Sold by
Blenheim Homes Lp
Bought by
Fuhrer Martin A
Home Financials for this Owner
Home Financials are based on the most recent Mortgage that was taken out on this home.
Original Mortgage
$241,614
Interest Rate
4.37%
Mortgage Type
Purchase Money Mortgage
Create a Home Valuation Report for This Property
The Home Valuation Report is an in-depth analysis detailing your home's value as well as a comparison with similar homes in the area
Home Values in the Area
Average Home Value in this Area
Purchase History
| Date | Buyer | Sale Price | Title Company |
|---|---|---|---|
| Marsh Joy T | -- | None Available | |
| Marsh Marcus K | $369,900 | None Available | |
| Fuhrer Martin A | $268,460 | -- |
Source: Public Records
Mortgage History
| Date | Status | Borrower | Loan Amount |
|---|---|---|---|
| Open | Marsh Joy T | $300,833 | |
| Closed | Marsh Marcus K | $295,920 | |
| Previous Owner | Fuhrer Martin A | $241,614 |
Source: Public Records
Tax History Compared to Growth
Tax History
| Year | Tax Paid | Tax Assessment Tax Assessment Total Assessment is a certain percentage of the fair market value that is determined by local assessors to be the total taxable value of land and additions on the property. | Land | Improvement |
|---|---|---|---|---|
| 2024 | $3,608 | $83,200 | $11,500 | $71,700 |
| 2023 | $3,086 | $83,200 | $11,500 | $71,700 |
| 2022 | $3,091 | $83,200 | $11,500 | $71,700 |
| 2021 | $3,052 | $83,200 | $11,500 | $71,700 |
| 2020 | $3,010 | $83,200 | $11,500 | $71,700 |
| 2019 | $3,073 | $83,200 | $11,500 | $71,700 |
| 2018 | $2,674 | $82,300 | $11,500 | $70,800 |
| 2017 | $2,565 | $82,300 | $11,500 | $70,800 |
| 2016 | $2,338 | $82,300 | $11,500 | $70,800 |
| 2015 | $2,278 | $82,300 | $11,500 | $70,800 |
| 2014 | $2,276 | $82,300 | $11,500 | $70,800 |
Source: Public Records
Map
Nearby Homes