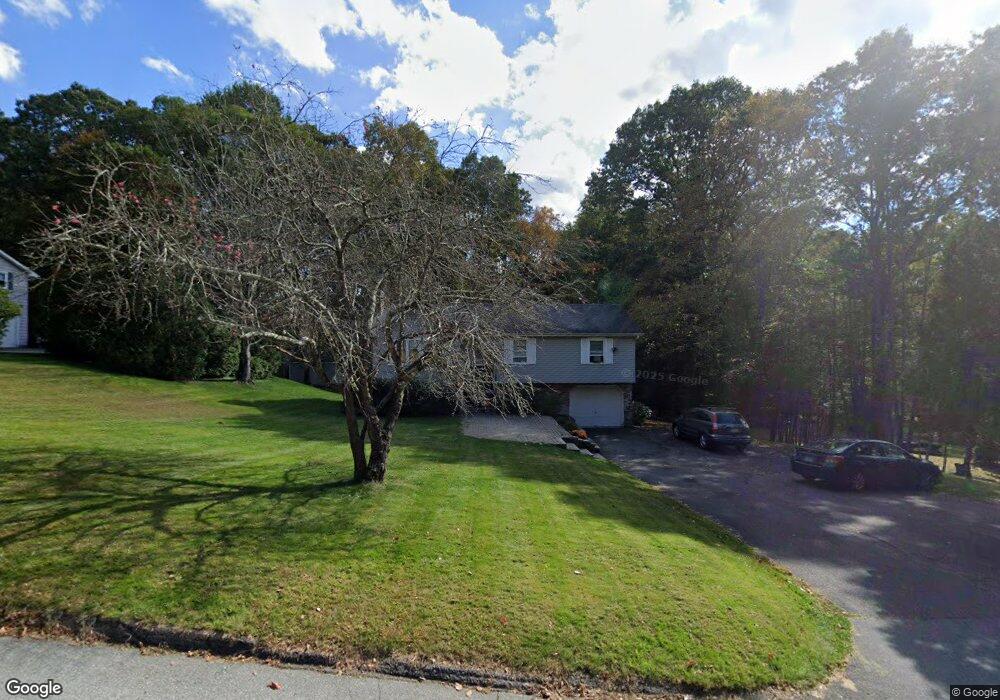
11 Sherry Dr East Hampton, CT 06424
Estimated Value: $317,000 - $377,000
3
Beds
3
Baths
1,132
Sq Ft
$318/Sq Ft
Est. Value
About This Home
This home is located at 11 Sherry Dr, East Hampton, CT 06424 and is currently estimated at $360,152, approximately $318 per square foot. 11 Sherry Dr is a home located in Middlesex County with nearby schools including Memorial School, Center Elementary School, and East Hampton Middle School.
Ownership History
Date
Name
Owned For
Owner Type
Purchase Details
Closed on
Dec 20, 2010
Sold by
Hurne Darin M
Bought by
Debrito Michelle L and Debrito Russell J
Current Estimated Value
Home Financials for this Owner
Home Financials are based on the most recent Mortgage that was taken out on this home.
Original Mortgage
$165,000
Outstanding Balance
$109,068
Interest Rate
4.23%
Estimated Equity
$251,084
Purchase Details
Closed on
Jun 24, 1991
Sold by
Stevens Leonard W
Bought by
Hurne Darin M and Hurne Christina M
Create a Home Valuation Report for This Property
The Home Valuation Report is an in-depth analysis detailing your home's value as well as a comparison with similar homes in the area
Home Values in the Area
Average Home Value in this Area
Purchase History
| Date | Buyer | Sale Price | Title Company |
|---|---|---|---|
| Debrito Michelle L | $230,000 | -- | |
| Debrito Michelle L | $230,000 | -- | |
| Hurne Darin M | $133,000 | -- |
Source: Public Records
Mortgage History
| Date | Status | Borrower | Loan Amount |
|---|---|---|---|
| Open | Hurne Darin M | $165,000 | |
| Closed | Hurne Darin M | $165,000 | |
| Previous Owner | Hurne Darin M | $96,500 | |
| Previous Owner | Hurne Darin M | $125,000 |
Source: Public Records
Tax History Compared to Growth
Tax History
| Year | Tax Paid | Tax Assessment Tax Assessment Total Assessment is a certain percentage of the fair market value that is determined by local assessors to be the total taxable value of land and additions on the property. | Land | Improvement |
|---|---|---|---|---|
| 2025 | $5,169 | $130,180 | $42,120 | $88,060 |
| 2024 | $4,952 | $130,180 | $42,120 | $88,060 |
| 2023 | $4,694 | $130,180 | $42,120 | $88,060 |
| 2022 | $4,512 | $130,180 | $42,120 | $88,060 |
| 2021 | $4,495 | $130,180 | $42,120 | $88,060 |
| 2020 | $4,279 | $129,130 | $41,380 | $87,750 |
| 2019 | $4,480 | $135,170 | $44,330 | $90,840 |
| 2018 | $4,234 | $135,170 | $44,330 | $90,840 |
| 2017 | $4,234 | $135,170 | $44,330 | $90,840 |
| 2016 | $3,979 | $135,170 | $44,330 | $90,840 |
| 2015 | $4,108 | $147,890 | $56,470 | $91,420 |
| 2014 | $3,575 | $147,890 | $56,470 | $91,420 |
Source: Public Records
Map
Nearby Homes