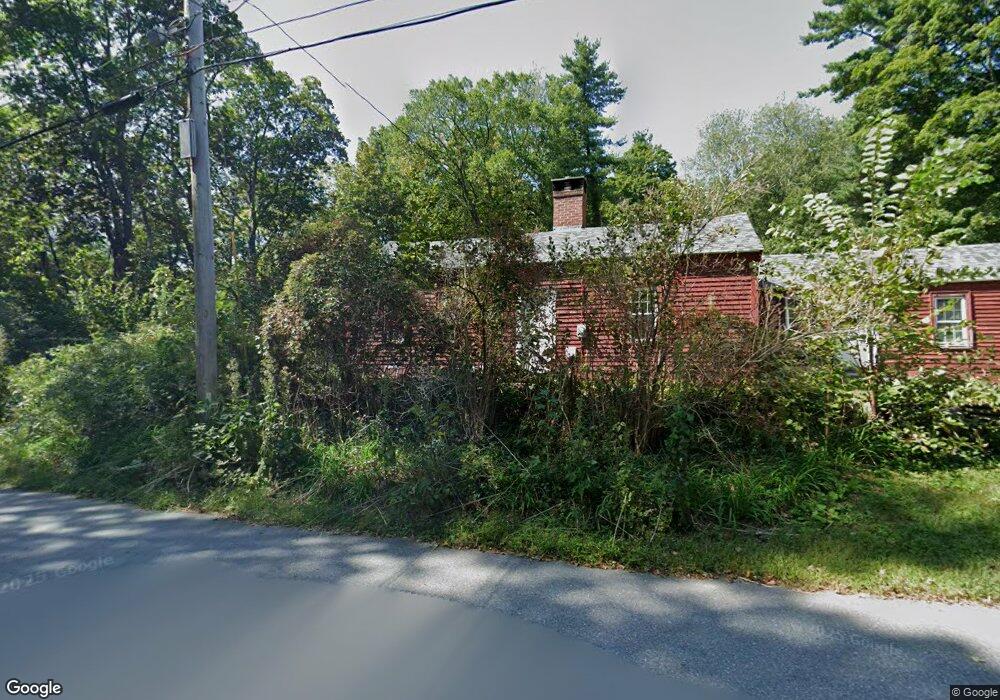
11 Shirley St Pepperell, MA 01463
Estimated Value: $350,000 - $541,000
2
Beds
1
Bath
959
Sq Ft
$439/Sq Ft
Est. Value
About This Home
This home is located at 11 Shirley St, Pepperell, MA 01463 and is currently estimated at $421,272, approximately $439 per square foot. 11 Shirley St is a home located in Middlesex County with nearby schools including North Middlesex Regional High School, Pepperell Christian Academy, and Maple Dene & Moppet School.
Ownership History
Date
Name
Owned For
Owner Type
Purchase Details
Closed on
Feb 14, 2007
Sold by
Fiske Macgregor
Bought by
Fox Kenneth and Bourke Mary
Current Estimated Value
Home Financials for this Owner
Home Financials are based on the most recent Mortgage that was taken out on this home.
Original Mortgage
$226,151
Outstanding Balance
$136,056
Interest Rate
6.24%
Mortgage Type
Purchase Money Mortgage
Estimated Equity
$285,216
Create a Home Valuation Report for This Property
The Home Valuation Report is an in-depth analysis detailing your home's value as well as a comparison with similar homes in the area
Home Values in the Area
Average Home Value in this Area
Purchase History
| Date | Buyer | Sale Price | Title Company |
|---|---|---|---|
| Fox Kenneth | $229,700 | -- |
Source: Public Records
Mortgage History
| Date | Status | Borrower | Loan Amount |
|---|---|---|---|
| Open | Fox Kenneth | $226,151 |
Source: Public Records
Tax History
| Year | Tax Paid | Tax Assessment Tax Assessment Total Assessment is a certain percentage of the fair market value that is determined by local assessors to be the total taxable value of land and additions on the property. | Land | Improvement |
|---|---|---|---|---|
| 2025 | $4,806 | $328,500 | $184,400 | $144,100 |
| 2024 | $4,484 | $312,500 | $168,400 | $144,100 |
| 2023 | $4,359 | $287,900 | $152,400 | $135,500 |
| 2022 | $4,284 | $249,800 | $136,300 | $113,500 |
| 2021 | $4,140 | $231,000 | $120,300 | $110,700 |
| 2020 | $3,938 | $231,900 | $120,300 | $111,600 |
| 2019 | $3,658 | $220,500 | $120,300 | $100,200 |
| 2018 | $393 | $209,700 | $120,300 | $89,400 |
| 2017 | $3,292 | $207,200 | $120,300 | $86,900 |
| 2016 | $3,329 | $201,400 | $120,300 | $81,100 |
| 2015 | $3,085 | $193,400 | $112,300 | $81,100 |
| 2014 | $3,028 | $190,900 | $112,300 | $78,600 |
Source: Public Records
Map
Nearby Homes
- 90 Townsend St
- 39 Mount Lebanon St
- 96 Townsend St
- 38 River Rd Unit 11
- 13 Birch Dr
- 69 Main St Unit 71
- 120 Townsend St Unit 1
- 120 Townsend St Unit 2
- 113-115 Main St
- 142 River Rd
- 39 Hollis St Unit A
- 72 Main St
- 14 Brookline St
- 28-30 Groton St
- 114 Groton St
- 18 Maple St Unit 14
- 29 Tarbell St
- 43 Shattuck St
- 38 Tarbell St Unit 1D
- 2 Blueberry Hill Rd
Your Personal Tour Guide
Ask me questions while you tour the home.