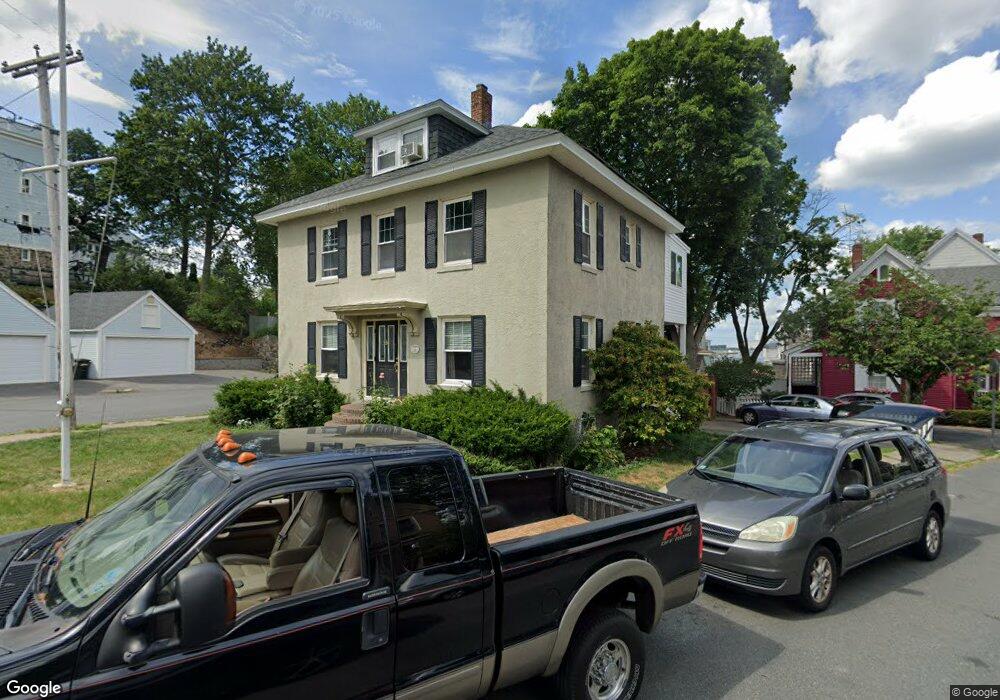
11 Shore Ave Unit 1 Salem, MA 01970
South Salem NeighborhoodEstimated Value: $669,000 - $849,476
2
Beds
1
Bath
850
Sq Ft
$921/Sq Ft
Est. Value
About This Home
This home is located at 11 Shore Ave Unit 1, Salem, MA 01970 and is currently estimated at $782,619, approximately $920 per square foot. 11 Shore Ave Unit 1 is a home located in Essex County with nearby schools including Saltonstall School, Horace Mann Laboratory, and Carlton Elementary School.
Ownership History
Date
Name
Owned For
Owner Type
Purchase Details
Closed on
Aug 13, 2020
Sold by
Prosniewski Conrad J and Prosniewski Julie A
Bought by
Marguranis Paul and Nguyen Phuong
Current Estimated Value
Home Financials for this Owner
Home Financials are based on the most recent Mortgage that was taken out on this home.
Original Mortgage
$627,339
Outstanding Balance
$556,494
Interest Rate
3%
Mortgage Type
FHA
Estimated Equity
$226,125
Purchase Details
Closed on
Nov 2, 2000
Sold by
Hadden Brian and Hadden Patricia M
Bought by
Michaud Roger A and Michaud Margaret G
Create a Home Valuation Report for This Property
The Home Valuation Report is an in-depth analysis detailing your home's value as well as a comparison with similar homes in the area
Home Values in the Area
Average Home Value in this Area
Purchase History
| Date | Buyer | Sale Price | Title Company |
|---|---|---|---|
| Marguranis Paul | $649,000 | None Available | |
| Michaud Roger A | $250,000 | -- |
Source: Public Records
Mortgage History
| Date | Status | Borrower | Loan Amount |
|---|---|---|---|
| Open | Marguranis Paul | $627,339 | |
| Previous Owner | Michaud Roger A | $339,000 | |
| Previous Owner | Michaud Roger A | $332,000 |
Source: Public Records
Tax History Compared to Growth
Tax History
| Year | Tax Paid | Tax Assessment Tax Assessment Total Assessment is a certain percentage of the fair market value that is determined by local assessors to be the total taxable value of land and additions on the property. | Land | Improvement |
|---|---|---|---|---|
| 2025 | $8,617 | $759,900 | $199,400 | $560,500 |
| 2024 | $8,243 | $709,400 | $189,500 | $519,900 |
| 2023 | $8,053 | $643,700 | $174,900 | $468,800 |
| 2022 | $8,037 | $606,600 | $169,100 | $437,500 |
| 2021 | $7,430 | $538,400 | $157,400 | $381,000 |
| 2020 | $7,187 | $497,400 | $148,700 | $348,700 |
| 2019 | $7,126 | $471,900 | $141,100 | $330,800 |
| 2018 | $6,464 | $420,300 | $134,100 | $286,200 |
| 2017 | $6,049 | $381,400 | $113,100 | $268,300 |
| 2016 | $5,895 | $376,200 | $107,900 | $268,300 |
| 2015 | $5,548 | $338,100 | $99,100 | $239,000 |
Source: Public Records
Map
Nearby Homes
- 17 Cliff St
- 4 Willow Ave Unit 2
- 327 Lafayette St Unit 2
- 9 Glover St Unit 1
- 24 Wisteria St Unit 2
- 14 Meadow St
- 10 Hazel St Unit 2
- 2A Hazel St Unit 3
- 16 Leavitt St Unit 2
- 7 Fairfield St
- 9 Lyme St
- 25 Perkins St
- 32 Park St
- 288-292 Washington & 5 Porter St Ct
- 263 Jefferson Ave
- 39 1/2 Harbor St Unit 1
- 1 Laurent Rd Unit 3
- 10 Horton St
- 25 Calabrese St
- 11 Sumner Rd