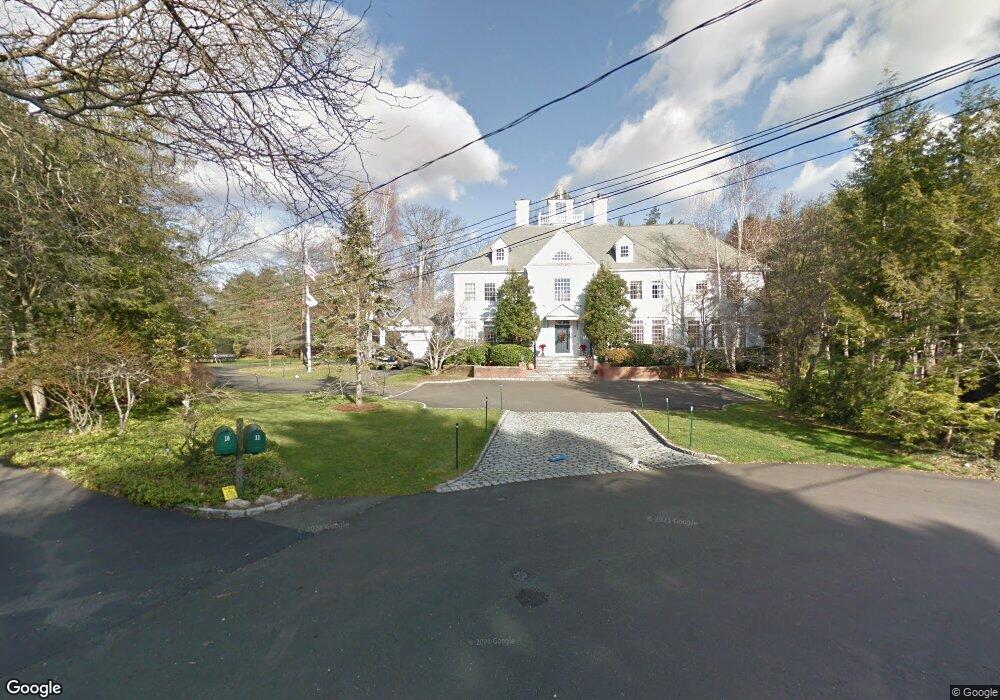
11 Sparrow Ln Greenwich, CT 06830
Mid-Country East NeighborhoodEstimated Value: $5,645,262 - $6,757,000
6
Beds
8
Baths
7,250
Sq Ft
$837/Sq Ft
Est. Value
About This Home
This home is located at 11 Sparrow Ln, Greenwich, CT 06830 and is currently estimated at $6,066,754, approximately $836 per square foot. 11 Sparrow Ln is a home located in Fairfield County with nearby schools including North Street School, Central Middle School, and Greenwich High School.
Ownership History
Date
Name
Owned For
Owner Type
Purchase Details
Closed on
Jun 17, 1999
Sold by
Furgatch Andrew L
Bought by
Vandervilt Hugh B and Bond-Vanderbilt Nancy
Current Estimated Value
Purchase Details
Closed on
Dec 19, 1997
Sold by
Miles Denise and Miles William H
Bought by
Furgatch Andrew L
Create a Home Valuation Report for This Property
The Home Valuation Report is an in-depth analysis detailing your home's value as well as a comparison with similar homes in the area
Home Values in the Area
Average Home Value in this Area
Purchase History
| Date | Buyer | Sale Price | Title Company |
|---|---|---|---|
| Vandervilt Hugh B | $2,500,000 | -- | |
| Furgatch Andrew L | $1,950,000 | -- |
Source: Public Records
Mortgage History
| Date | Status | Borrower | Loan Amount |
|---|---|---|---|
| Open | Furgatch Andrew L | $1,364,500 | |
| Closed | Furgatch Andrew L | $749,000 | |
| Closed | Furgatch Andrew L | $1,951,000 |
Source: Public Records
Tax History Compared to Growth
Tax History
| Year | Tax Paid | Tax Assessment Tax Assessment Total Assessment is a certain percentage of the fair market value that is determined by local assessors to be the total taxable value of land and additions on the property. | Land | Improvement |
|---|---|---|---|---|
| 2025 | $35,166 | $2,845,360 | $1,070,370 | $1,774,990 |
| 2024 | $33,962 | $2,845,360 | $1,070,370 | $1,774,990 |
| 2023 | $33,109 | $2,845,360 | $1,070,370 | $1,774,990 |
| 2022 | $32,807 | $2,845,360 | $1,070,370 | $1,774,990 |
| 2021 | $36,501 | $3,031,630 | $810,530 | $2,221,100 |
| 2020 | $36,440 | $3,031,630 | $810,530 | $2,221,100 |
| 2019 | $36,131 | $2,976,190 | $755,090 | $2,221,100 |
| 2018 | $35,327 | $2,976,190 | $755,090 | $2,221,100 |
| 2017 | $34,436 | $2,865,170 | $755,090 | $2,110,080 |
| 2016 | $33,048 | $2,793,840 | $753,130 | $2,040,710 |
| 2015 | $32,190 | $2,699,410 | $1,060,850 | $1,638,560 |
| 2014 | $31,381 | $2,699,410 | $1,060,850 | $1,638,560 |
Source: Public Records
Map
Nearby Homes
- 7 Parsonage Rd
- 382 North St
- 24 Sawmill Ln
- 10 Birch Ln
- 32 Pheasant Ln
- 151 Old Church Rd
- 116 Birch Ln
- 16 Martin Dale N
- 11 Bobolink Ln
- 10 Copper Beech Rd
- 43 Sawmill Ln
- 555 Lake Ave
- 10 Tomahawk Ln
- 477 Lake Ave
- 50 North St
- 546 Lake Ave
- 636 Steamboat Rd Unit 3 A,B & E
- 583 Lake Ave
- 2 Winding Ln
- 88 Valleywood Rd