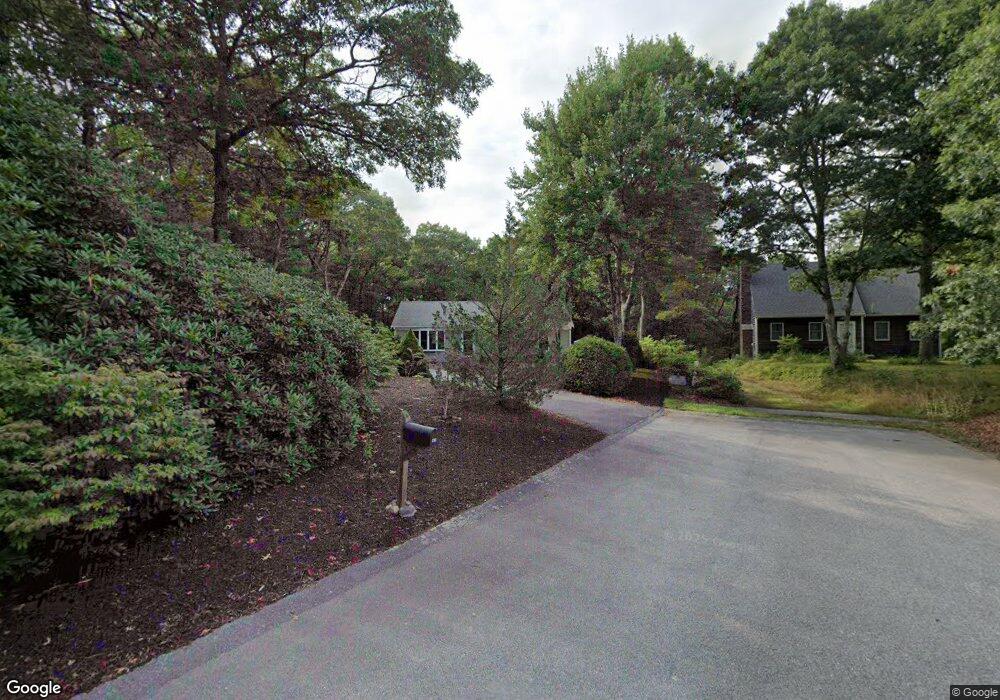
11 Spur Ln East Falmouth, MA 02536
Hatchville NeighborhoodEstimated Value: $495,000 - $622,000
3
Beds
2
Baths
1,232
Sq Ft
$461/Sq Ft
Est. Value
About This Home
This home is located at 11 Spur Ln, East Falmouth, MA 02536 and is currently estimated at $567,707, approximately $460 per square foot. 11 Spur Ln is a home located in Barnstable County with nearby schools including Mullen-Hall School, Morse Pond School, and Lawrence School.
Ownership History
Date
Name
Owned For
Owner Type
Purchase Details
Closed on
Apr 6, 1990
Sold by
Mapstone Naomi
Bought by
Tundidor David
Current Estimated Value
Home Financials for this Owner
Home Financials are based on the most recent Mortgage that was taken out on this home.
Original Mortgage
$96,000
Interest Rate
10.22%
Mortgage Type
Purchase Money Mortgage
Create a Home Valuation Report for This Property
The Home Valuation Report is an in-depth analysis detailing your home's value as well as a comparison with similar homes in the area
Home Values in the Area
Average Home Value in this Area
Purchase History
| Date | Buyer | Sale Price | Title Company |
|---|---|---|---|
| Tundidor David | $120,000 | -- | |
| Tundidor David | $120,000 | -- |
Source: Public Records
Mortgage History
| Date | Status | Borrower | Loan Amount |
|---|---|---|---|
| Open | Tundidor David | $86,300 | |
| Closed | Tundidor David | $96,000 |
Source: Public Records
Tax History Compared to Growth
Tax History
| Year | Tax Paid | Tax Assessment Tax Assessment Total Assessment is a certain percentage of the fair market value that is determined by local assessors to be the total taxable value of land and additions on the property. | Land | Improvement |
|---|---|---|---|---|
| 2025 | $2,689 | $458,100 | $149,100 | $309,000 |
| 2024 | $2,602 | $414,400 | $134,900 | $279,500 |
| 2023 | $2,580 | $372,800 | $134,900 | $237,900 |
| 2022 | $2,293 | $284,900 | $84,900 | $200,000 |
| 2021 | $2,215 | $260,600 | $81,200 | $179,400 |
| 2020 | $2,175 | $253,200 | $73,800 | $179,400 |
| 2019 | $1,961 | $229,100 | $73,800 | $155,300 |
| 2018 | $1,884 | $219,100 | $73,800 | $145,300 |
| 2017 | $1,825 | $213,900 | $73,800 | $140,100 |
| 2016 | $1,790 | $213,900 | $73,800 | $140,100 |
| 2015 | $1,752 | $213,900 | $73,800 | $140,100 |
| 2014 | $1,764 | $216,500 | $77,600 | $138,900 |
Source: Public Records
Map
Nearby Homes
- 12 Rock Hollow Dr
- 59 Whitecaps Dr
- 12 Beach Plum Path
- 68 Deepwood Dr
- 47 Shallow Pond Ln
- 34 Mckenna Ridge Rd
- 11 Shallow Pond Ln
- 61 Mckenna Ridge Dr
- 17 Pinewood Dr
- 4 Josiah Path
- 7 Josiah Path
- 18 Josiah Path
- 20 Josiah Path
- 21 Josiah Path
- 30 Josiah Path
- 590 Sandwich Rd
- 25 Harris Hill Rd
- 273 Sandwich Rd
- 70 Meredith Dr
- 7 Spur Ln
- 3 Spur Ln
- 90 Deer Pond Rd
- 102 Deer Pond Rd
- 80 Deer Pond Rd
- 100 Sand Point Shores Dr
- 98 Deer Pond Rd
- 77 Sand Point Shores Dr
- 81 Sand Point Shores Dr
- 110 Sand Point Shores Dr
- 101 Sand Point Shores Dr
- 72 Deer Pond Rd
- 5 Shagbark Ln
- 71 Sand Point Shores Dr
- 107 Sand Point Shores Dr
- 67 Sand Point Shores Dr
- 67 Sand Point Shores Dr
- 111 Sand Point Shores Dr
- 120A Deer Pond Rd
- 120 Deer Pond Rd