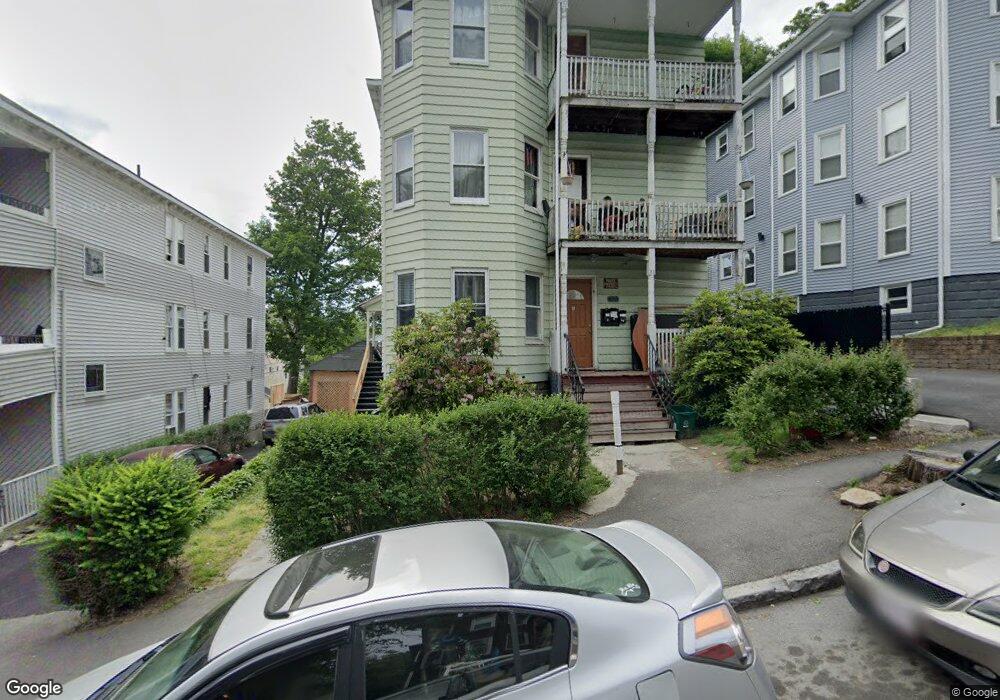
11 Stanton St Worcester, MA 01605
Bell Hill NeighborhoodEstimated Value: $570,000 - $742,000
6
Beds
3
Baths
2,936
Sq Ft
$229/Sq Ft
Est. Value
About This Home
This home is located at 11 Stanton St, Worcester, MA 01605 and is currently estimated at $671,333, approximately $228 per square foot. 11 Stanton St is a home located in Worcester County with nearby schools including Jacob Hiatt Magnet School, Chandler Magnet, and Worcester East Middle School.
Ownership History
Date
Name
Owned For
Owner Type
Purchase Details
Closed on
Dec 18, 2018
Sold by
Randev Harinder K and Randev Sarita
Bought by
Randev Irt
Current Estimated Value
Purchase Details
Closed on
Nov 24, 2008
Sold by
Citi Res Lending Inc
Bought by
Randev Harinder K and Randev Sarita
Purchase Details
Closed on
Jun 23, 2008
Sold by
Gara Luzia and Citi Res Lending Inc
Bought by
Deutsche Bank Natl T C
Purchase Details
Closed on
Nov 6, 2003
Sold by
Ferro Angela M and Ferro James M
Bought by
Gara Claricio and Gara Luzia
Home Financials for this Owner
Home Financials are based on the most recent Mortgage that was taken out on this home.
Original Mortgage
$206,400
Interest Rate
6.01%
Mortgage Type
Purchase Money Mortgage
Create a Home Valuation Report for This Property
The Home Valuation Report is an in-depth analysis detailing your home's value as well as a comparison with similar homes in the area
Home Values in the Area
Average Home Value in this Area
Purchase History
| Date | Buyer | Sale Price | Title Company |
|---|---|---|---|
| Randev Irt | -- | -- | |
| Randev Harinder K | $82,000 | -- | |
| Deutsche Bank Natl T C | $248,400 | -- | |
| Gara Claricio | $258,000 | -- |
Source: Public Records
Mortgage History
| Date | Status | Borrower | Loan Amount |
|---|---|---|---|
| Previous Owner | Gara Claricio | $206,400 |
Source: Public Records
Tax History
| Year | Tax Paid | Tax Assessment Tax Assessment Total Assessment is a certain percentage of the fair market value that is determined by local assessors to be the total taxable value of land and additions on the property. | Land | Improvement |
|---|---|---|---|---|
| 2025 | $6,404 | $485,500 | $81,200 | $404,300 |
| 2024 | $5,933 | $431,500 | $81,200 | $350,300 |
| 2023 | $5,682 | $396,200 | $70,600 | $325,600 |
| 2022 | $4,957 | $325,900 | $56,500 | $269,400 |
| 2021 | $3,868 | $237,600 | $45,200 | $192,400 |
| 2020 | $3,611 | $212,400 | $44,900 | $167,500 |
| 2019 | $3,593 | $199,600 | $39,200 | $160,400 |
| 2018 | $3,530 | $186,700 | $39,200 | $147,500 |
| 2017 | $3,333 | $173,400 | $39,200 | $134,200 |
| 2016 | $3,162 | $153,400 | $28,300 | $125,100 |
| 2015 | $3,079 | $153,400 | $28,300 | $125,100 |
| 2014 | $2,997 | $153,400 | $28,300 | $125,100 |
Source: Public Records
Map
Nearby Homes
- 7 Stanton St
- 15 Stanton St
- 15 Stanton St
- 15 Stanton St Unit 3
- 19 Stanton St
- 10 Everard St
- 14 Everard St
- 12 Everard St
- 197 Belmont St
- 12 Stanton St
- 12 Stanton St Unit 3
- 12 Stanton St Unit 2
- 16 Everard St
- 16 Everard St Unit 3
- 8 Everard St Unit 2
- 8 Everard St Unit 1,2,3
- 8 Everard St
- 21 Stanton St
- 16 Stanton St
- 20 Stanton St
Your Personal Tour Guide
Ask me questions while you tour the home.