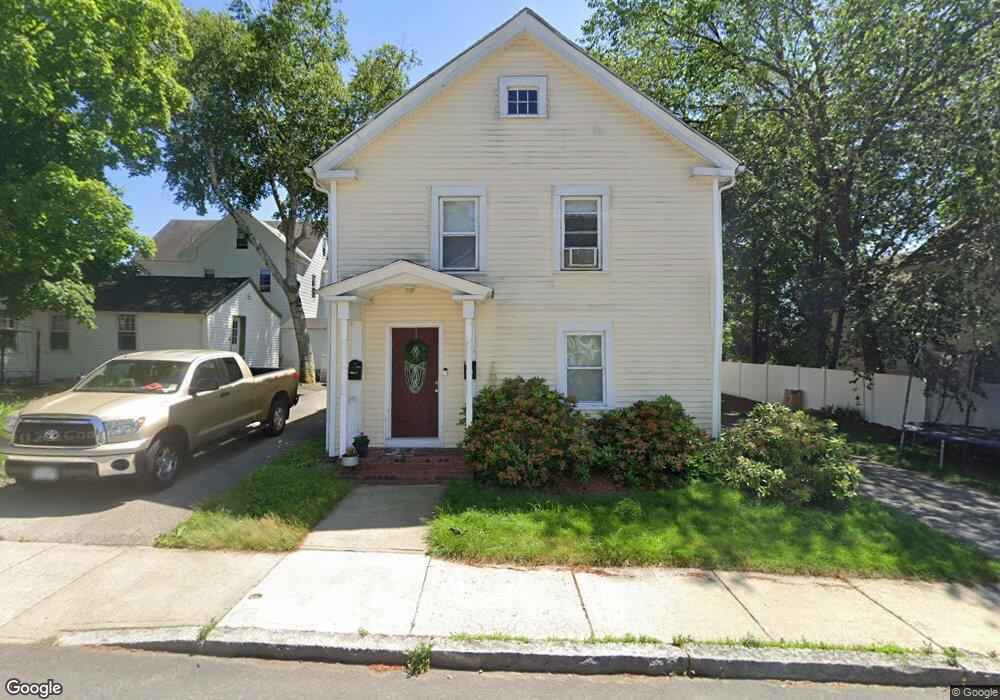
11 Summer St Nashua, NH 03064
North End Nashua NeighborhoodEstimated Value: $535,403 - $564,000
4
Beds
3
Baths
2,768
Sq Ft
$198/Sq Ft
Est. Value
About This Home
This home is located at 11 Summer St, Nashua, NH 03064 and is currently estimated at $547,101, approximately $197 per square foot. 11 Summer St is a home located in Hillsborough County with nearby schools including Mount Pleasant Elementary School, Pennichuck Middle School, and Nashua High School North.
Ownership History
Date
Name
Owned For
Owner Type
Purchase Details
Closed on
Jan 20, 2010
Sold by
Taylor Bean and Taylor Whitaker M
Bought by
11 Summer Street Llc
Current Estimated Value
Purchase Details
Closed on
Jun 21, 2007
Sold by
Felix Richard R
Bought by
Buyer
Purchase Details
Closed on
Nov 29, 1999
Sold by
Tucke Peter
Bought by
Felix Richard R and Felix Mary L
Create a Home Valuation Report for This Property
The Home Valuation Report is an in-depth analysis detailing your home's value as well as a comparison with similar homes in the area
Home Values in the Area
Average Home Value in this Area
Purchase History
| Date | Buyer | Sale Price | Title Company |
|---|---|---|---|
| 11 Summer Street Llc | $120,000 | -- | |
| Buyer | $283,600 | -- | |
| Felix Richard R | $87,000 | -- |
Source: Public Records
Mortgage History
| Date | Status | Borrower | Loan Amount |
|---|---|---|---|
| Open | Felix Richard R | $175,000 | |
| Previous Owner | Felix Richard R | $40,000 | |
| Previous Owner | Felix Richard R | $272,000 |
Source: Public Records
Tax History Compared to Growth
Tax History
| Year | Tax Paid | Tax Assessment Tax Assessment Total Assessment is a certain percentage of the fair market value that is determined by local assessors to be the total taxable value of land and additions on the property. | Land | Improvement |
|---|---|---|---|---|
| 2024 | $8,088 | $508,700 | $127,200 | $381,500 |
| 2023 | $7,174 | $393,500 | $101,700 | $291,800 |
| 2022 | $7,111 | $393,500 | $101,700 | $291,800 |
| 2021 | $3,200 | $137,800 | $67,800 | $70,000 |
| 2020 | $8,419 | $137,400 | $67,800 | $69,600 |
| 2019 | $2,990 | $137,400 | $67,800 | $69,600 |
| 2018 | $2,914 | $137,400 | $67,800 | $69,600 |
| 2017 | $430,199 | $152,100 | $89,000 | $63,100 |
| 2016 | $3,813 | $152,100 | $89,000 | $63,100 |
| 2015 | $3,731 | $152,100 | $89,000 | $63,100 |
| 2014 | $3,709 | $154,200 | $89,000 | $65,200 |
Source: Public Records
Map
Nearby Homes
- 36-38 Courtland St
- 46 Perham St Unit 214
- 71 Concord St
- 11 Charles St
- 4 Reservoir St
- 19 Atherton Ave
- 15 Atherton Ave
- 13 Sapphire Ln
- 0 Baldwin St
- 21 Edson St
- 38 Central St
- 19 Bartlett Ave
- 31 Juliana Ave
- 31 Juliana Ave Unit 4
- 5 Mulberry St
- 3 Opal Way Unit 3
- 1 Opal Way Unit 1
- 2 Opal Way Unit 2
- 12 Juliana Ave Unit 14
- 11 Juliana Ave Unit 52
- 24 Granite St
- 9 Summer St
- 12 1/2 Summer St
- 12 Summer St Unit 121/2
- 5 Summer St
- 10 1/2 Summer St
- 10 Summer St Unit 101/2
- 10 +10.5 Summer
- 28 Granite St Unit 30
- 7 Summer #3 St Unit 3
- 7 Summer St
- 7 Summer St
- 7 Summer St Unit 2
- 7 Summer St Unit 1
- 7 Summer St Unit 1
- 7 Summer St Unit s 1 & 3
- 7 Summer St Unit 3
- 20 Granite St Unit 221/2
- 25 Granite St
- 23 Granite St