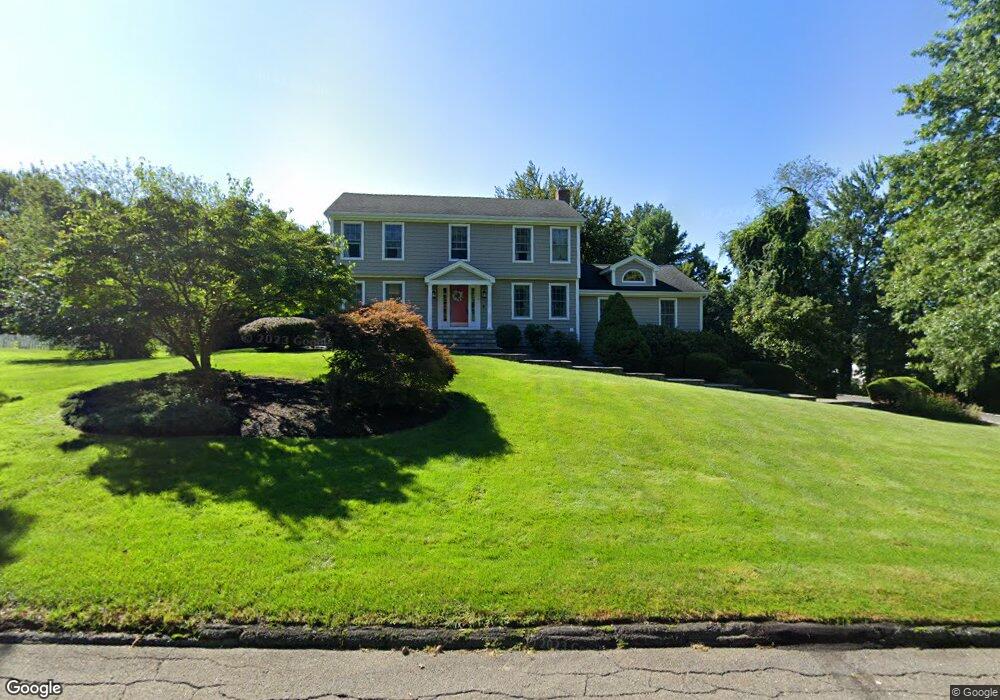
11 Summer View Dr Monroe, CT 06468
Estimated Value: $763,289 - $930,000
4
Beds
4
Baths
2,604
Sq Ft
$320/Sq Ft
Est. Value
About This Home
This home is located at 11 Summer View Dr, Monroe, CT 06468 and is currently estimated at $833,322, approximately $320 per square foot. 11 Summer View Dr is a home located in Fairfield County with nearby schools including Fawn Hollow Elementary School, Jockey Hollow Middle School, and Masuk High School.
Ownership History
Date
Name
Owned For
Owner Type
Purchase Details
Closed on
Feb 16, 2011
Sold by
Rigby Nicholas E and Rigby Christine A
Bought by
Vanderheyden Daniel L and Vanderheyden Michelle A
Current Estimated Value
Purchase Details
Closed on
Mar 21, 2005
Sold by
Turcotte Jean-Francois and Crook Stephanie S
Bought by
Rigby Nicholas E and Rigby Christine A
Purchase Details
Closed on
Dec 5, 2003
Sold by
Young James M
Bought by
Turcotte Jean-Francis and Crrook Stephanie S
Purchase Details
Closed on
Mar 22, 1999
Sold by
Staheli Todd D and Staheli Kimberly L
Bought by
Young James M and Young Linda R
Purchase Details
Closed on
Sep 15, 1993
Sold by
Mccarthy Charles and Mccarthy Anne
Bought by
Staheli Todd and Staheli Kimberly
Create a Home Valuation Report for This Property
The Home Valuation Report is an in-depth analysis detailing your home's value as well as a comparison with similar homes in the area
Home Values in the Area
Average Home Value in this Area
Purchase History
| Date | Buyer | Sale Price | Title Company |
|---|---|---|---|
| Vanderheyden Daniel L | $502,500 | -- | |
| Vanderheyden Daniel L | $502,500 | -- | |
| Rigby Nicholas E | $577,700 | -- | |
| Rigby Nicholas E | $577,700 | -- | |
| Turcotte Jean-Francis | $548,000 | -- | |
| Turcotte Jean-Francis | $548,000 | -- | |
| Young James M | $365,000 | -- | |
| Young James M | $365,000 | -- | |
| Staheli Todd | $212,000 | -- | |
| Staheli Todd | $212,000 | -- |
Source: Public Records
Mortgage History
| Date | Status | Borrower | Loan Amount |
|---|---|---|---|
| Closed | Staheli Todd | $416,000 | |
| Closed | Staheli Todd | $412,000 |
Source: Public Records
Tax History
| Year | Tax Paid | Tax Assessment Tax Assessment Total Assessment is a certain percentage of the fair market value that is determined by local assessors to be the total taxable value of land and additions on the property. | Land | Improvement |
|---|---|---|---|---|
| 2025 | $13,617 | $474,970 | $136,570 | $338,400 |
| 2024 | $12,568 | $328,400 | $118,400 | $210,000 |
| 2023 | $12,331 | $328,400 | $118,400 | $210,000 |
| 2022 | $12,105 | $328,400 | $118,400 | $210,000 |
| 2021 | $11,941 | $328,400 | $118,400 | $210,000 |
| 2020 | $11,652 | $328,400 | $118,400 | $210,000 |
| 2019 | $11,763 | $330,600 | $113,900 | $216,700 |
| 2018 | $11,650 | $330,600 | $113,900 | $216,700 |
| 2017 | $11,822 | $330,600 | $113,900 | $216,700 |
| 2016 | $11,571 | $330,600 | $113,900 | $216,700 |
| 2015 | $11,356 | $330,600 | $113,900 | $216,700 |
| 2014 | $10,986 | $354,270 | $150,220 | $204,050 |
Source: Public Records
Map
Nearby Homes
- 32 Valley View Rd
- 96 Big Horn Rd
- 7 Canterbury Ln
- 1093 Monroe Turnpike
- 455 Barn Hill Rd
- 1115 Monroe Turnpike
- 1161 Monroe Turnpike
- 128 Barn Hill Rd
- 36 Spinning Wheel Rd
- 56 Lazy Brook Rd
- 30 E Village Rd
- 3 Behrens Terrace Unit 3
- 15 Legacy Ln
- 13 Legacy Ln
- 24 Legacy Ln
- 124 Old Tannery Rd
- 249 Wheeler Rd
- 40 Walnut St
- 114 Turkey Roost Rd
- 6 Chaucer Dr
- 5 Summer View Dr
- 18 Summer View Dr
- 295 Barn Hill Rd
- 283 Barn Hill Rd
- 23 Summer View Dr
- 288 Barn Hill Rd
- 294 Barn Hill Rd
- 282 Barn Hill Rd
- 50 Highfield Dr
- 300 Barn Hill Rd
- 42 Highfield Dr
- 303 Barn Hill Rd
- 38 Highfield Dr
- 271 Barn Hill Rd
- 274 Barn Hill Rd
- 309 Barn Hill Rd
- 34 Highfield Dr
- 5 Camelot Dr
- 12 Camelot Dr
- 15 Valley View Rd
Your Personal Tour Guide
Ask me questions while you tour the home.