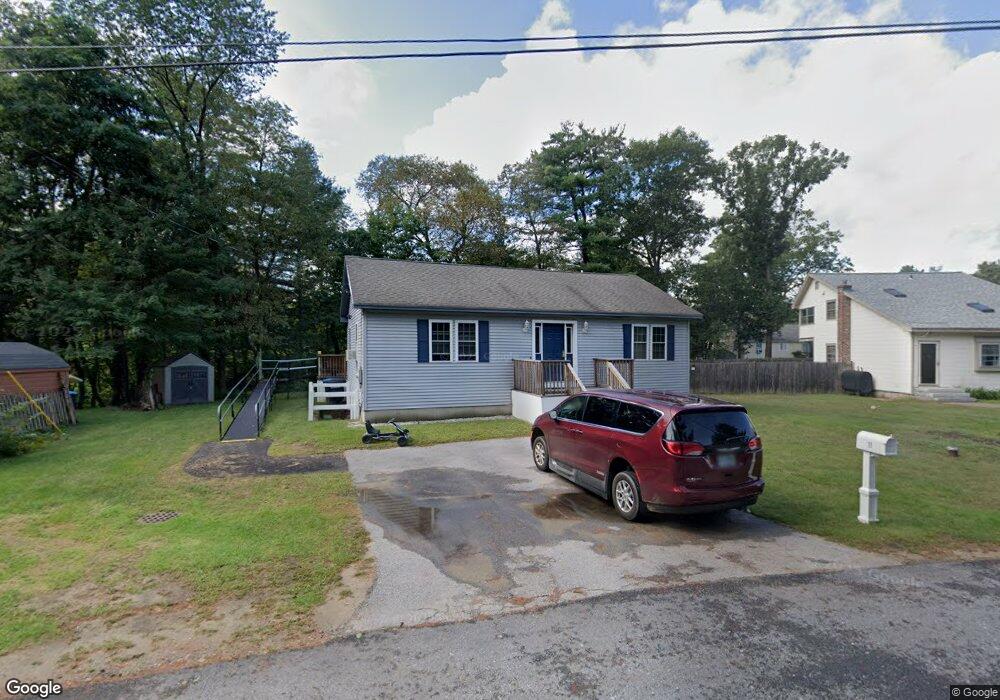
11 Summers Ave Allenstown, NH 03275
Estimated Value: $331,000 - $403,000
3
Beds
1
Bath
1,530
Sq Ft
$242/Sq Ft
Est. Value
About This Home
This home is located at 11 Summers Ave, Allenstown, NH 03275 and is currently estimated at $370,516, approximately $242 per square foot. 11 Summers Ave is a home located in Merrimack County with nearby schools including Allenstown Elementary School, Armand R. Dupont School, and Tender Years Child Care & Learning Center.
Ownership History
Date
Name
Owned For
Owner Type
Purchase Details
Closed on
Jun 15, 2011
Sold by
Cld Asset Management L
Bought by
Jackson Brisan D and Zinis Jessie L
Current Estimated Value
Home Financials for this Owner
Home Financials are based on the most recent Mortgage that was taken out on this home.
Original Mortgage
$117,900
Outstanding Balance
$81,696
Interest Rate
4.74%
Mortgage Type
Purchase Money Mortgage
Estimated Equity
$288,820
Purchase Details
Closed on
Jan 7, 2011
Sold by
Mcgrath Kevin A
Bought by
Cld Asset Management L
Home Financials for this Owner
Home Financials are based on the most recent Mortgage that was taken out on this home.
Original Mortgage
$95,950
Interest Rate
4.4%
Mortgage Type
Purchase Money Mortgage
Create a Home Valuation Report for This Property
The Home Valuation Report is an in-depth analysis detailing your home's value as well as a comparison with similar homes in the area
Home Values in the Area
Average Home Value in this Area
Purchase History
| Date | Buyer | Sale Price | Title Company |
|---|---|---|---|
| Jackson Brisan D | $131,000 | -- | |
| Cld Asset Management L | $67,000 | -- |
Source: Public Records
Mortgage History
| Date | Status | Borrower | Loan Amount |
|---|---|---|---|
| Open | Cld Asset Management L | $117,900 | |
| Previous Owner | Cld Asset Management L | $95,950 |
Source: Public Records
Tax History Compared to Growth
Tax History
| Year | Tax Paid | Tax Assessment Tax Assessment Total Assessment is a certain percentage of the fair market value that is determined by local assessors to be the total taxable value of land and additions on the property. | Land | Improvement |
|---|---|---|---|---|
| 2024 | $7,473 | $294,000 | $145,200 | $148,800 |
| 2023 | $6,233 | $294,000 | $145,200 | $148,800 |
| 2022 | $5,733 | $294,000 | $145,200 | $148,800 |
| 2021 | $5,355 | $170,000 | $82,500 | $87,500 |
| 2020 | $4,981 | $170,000 | $82,500 | $87,500 |
| 2019 | $5,278 | $169,700 | $82,500 | $87,200 |
| 2018 | $5,116 | $169,700 | $82,500 | $87,200 |
| 2017 | $5,449 | $169,700 | $82,500 | $87,200 |
| 2016 | $4,866 | $143,700 | $55,000 | $88,700 |
| 2015 | $4,599 | $140,100 | $55,000 | $85,100 |
| 2014 | $4,733 | $140,100 | $55,000 | $85,100 |
| 2013 | $4,417 | $140,100 | $55,000 | $85,100 |
Source: Public Records
Map
Nearby Homes
- 9 Pine Acres Rd
- 5 Catamount Hill Dr
- 101 4th Range Rd Unit 4
- 1 Jefferson Ave
- 11 Presidential Dr
- 8 Bush Ave
- 43 Catamount Hill Dr
- 1 1/2 Bartlett St
- 41 Monroe Ave
- 111 Glass St
- 19 Sullivan Dr
- 259 Pembroke St
- 12-14 Church St Unit 12,14
- 10 Lane Dr
- 100 Main St Unit M10
- 100 Main St Unit 204
- 422 Dawn Dr Unit 23
- 427 Dawn Dr Unit 15
- 15 Sullivan Dr
- 441 Blane Cir Unit 12