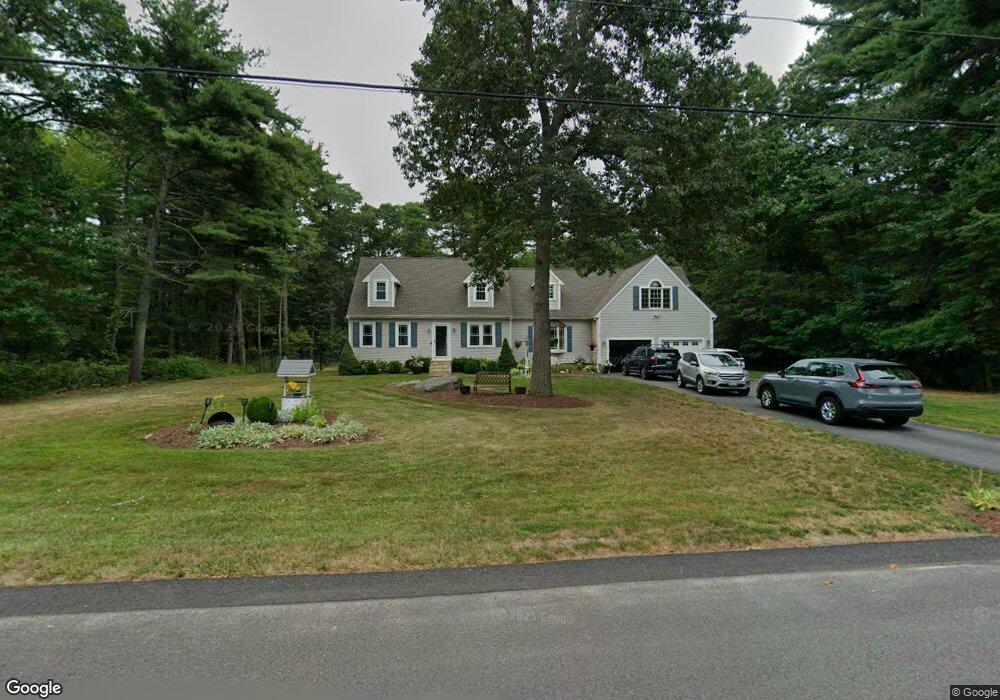
11 Susan Dr Berkley, MA 02779
Estimated Value: $654,000 - $785,000
3
Beds
4
Baths
2,581
Sq Ft
$278/Sq Ft
Est. Value
About This Home
This home is located at 11 Susan Dr, Berkley, MA 02779 and is currently estimated at $717,587, approximately $278 per square foot. 11 Susan Dr is a home located in Bristol County with nearby schools including Berkley Community School.
Ownership History
Date
Name
Owned For
Owner Type
Purchase Details
Closed on
Feb 4, 2022
Sold by
Fruzzetti Elizabeth T and Fruzzetti Russell J
Bought by
Moody Christopher R and Moody Jennifer
Current Estimated Value
Home Financials for this Owner
Home Financials are based on the most recent Mortgage that was taken out on this home.
Original Mortgage
$497,178
Outstanding Balance
$459,317
Interest Rate
3.45%
Mortgage Type
Purchase Money Mortgage
Estimated Equity
$258,270
Purchase Details
Closed on
Nov 25, 1992
Sold by
Braintree Coop Bk
Bought by
Zruzzetti Russell J
Create a Home Valuation Report for This Property
The Home Valuation Report is an in-depth analysis detailing your home's value as well as a comparison with similar homes in the area
Home Values in the Area
Average Home Value in this Area
Purchase History
| Date | Buyer | Sale Price | Title Company |
|---|---|---|---|
| Moody Christopher R | $486,000 | None Available | |
| Zruzzetti Russell J | $134,000 | -- | |
| Zruzzetti Russell J | $134,000 | -- |
Source: Public Records
Mortgage History
| Date | Status | Borrower | Loan Amount |
|---|---|---|---|
| Open | Moody Christopher R | $497,178 | |
| Previous Owner | Zruzzetti Russell J | $145,000 | |
| Previous Owner | Zruzzetti Russell J | $145,000 | |
| Previous Owner | Zruzzetti Russell J | $157,000 |
Source: Public Records
Tax History Compared to Growth
Tax History
| Year | Tax Paid | Tax Assessment Tax Assessment Total Assessment is a certain percentage of the fair market value that is determined by local assessors to be the total taxable value of land and additions on the property. | Land | Improvement |
|---|---|---|---|---|
| 2025 | $85 | $711,800 | $162,200 | $549,600 |
| 2024 | $7,802 | $626,700 | $104,700 | $522,000 |
| 2023 | $7,267 | $549,700 | $99,200 | $450,500 |
| 2022 | $6,700 | $487,300 | $99,200 | $388,100 |
| 2021 | $6,563 | $459,600 | $99,200 | $360,400 |
| 2020 | $6,809 | $468,600 | $108,400 | $360,200 |
| 2019 | $6,572 | $448,900 | $110,700 | $338,200 |
| 2018 | $6,072 | $433,100 | $110,700 | $322,400 |
| 2017 | $5,863 | $410,000 | $130,900 | $279,100 |
| 2016 | $5,653 | $380,900 | $130,900 | $250,000 |
| 2015 | $5,074 | $364,800 | $130,900 | $233,900 |
| 2014 | $4,677 | $365,100 | $130,900 | $234,200 |
Source: Public Records
Map
Nearby Homes