11 Swan Ln Andover, MA 01810
Shawsheen Heights NeighborhoodEstimated Value: $1,468,000 - $1,688,000
3
Beds
5
Baths
3,700
Sq Ft
$425/Sq Ft
Est. Value
About This Home
This home is located at 11 Swan Ln, Andover, MA 01810 and is currently estimated at $1,571,357, approximately $424 per square foot. 11 Swan Ln is a home located in Essex County with nearby schools including West Elementary School, Andover West Middle School, and Andover High School.
Ownership History
Date
Name
Owned For
Owner Type
Purchase Details
Closed on
Nov 8, 2021
Sold by
Nash Robert M and Nash Denise M
Bought by
Denise M Nash 2014 Ret
Current Estimated Value
Purchase Details
Closed on
May 2, 2012
Sold by
Sigman Scott A
Bought by
Nash Robert M and Nash Denise M
Home Financials for this Owner
Home Financials are based on the most recent Mortgage that was taken out on this home.
Original Mortgage
$417,000
Interest Rate
4.08%
Mortgage Type
New Conventional
Purchase Details
Closed on
Jul 24, 2009
Sold by
Int Ca and Cormier Yvon
Bought by
Sigman Scott A
Home Financials for this Owner
Home Financials are based on the most recent Mortgage that was taken out on this home.
Original Mortgage
$523,750
Interest Rate
5.58%
Mortgage Type
Purchase Money Mortgage
Create a Home Valuation Report for This Property
The Home Valuation Report is an in-depth analysis detailing your home's value as well as a comparison with similar homes in the area
Home Values in the Area
Average Home Value in this Area
Purchase History
| Date | Buyer | Sale Price | Title Company |
|---|---|---|---|
| Denise M Nash 2014 Ret | -- | None Available | |
| Nash Robert M | $820,000 | -- | |
| Sigman Scott A | $900,000 | -- |
Source: Public Records
Mortgage History
| Date | Status | Borrower | Loan Amount |
|---|---|---|---|
| Previous Owner | Nash Robert M | $417,000 | |
| Previous Owner | Sigman Scott A | $523,750 |
Source: Public Records
Tax History
| Year | Tax Paid | Tax Assessment Tax Assessment Total Assessment is a certain percentage of the fair market value that is determined by local assessors to be the total taxable value of land and additions on the property. | Land | Improvement |
|---|---|---|---|---|
| 2024 | $15,381 | $1,194,200 | $0 | $1,194,200 |
| 2023 | $14,884 | $1,089,600 | $0 | $1,089,600 |
| 2022 | $13,950 | $955,500 | $0 | $955,500 |
| 2021 | $14,159 | $926,000 | $0 | $926,000 |
| 2020 | $13,604 | $906,300 | $0 | $906,300 |
| 2019 | $13,650 | $893,900 | $0 | $893,900 |
| 2018 | $13,524 | $864,700 | $0 | $864,700 |
| 2017 | $13,062 | $860,500 | $0 | $860,500 |
| 2016 | $12,806 | $864,100 | $0 | $864,100 |
| 2015 | $12,214 | $815,900 | $0 | $815,900 |
Source: Public Records
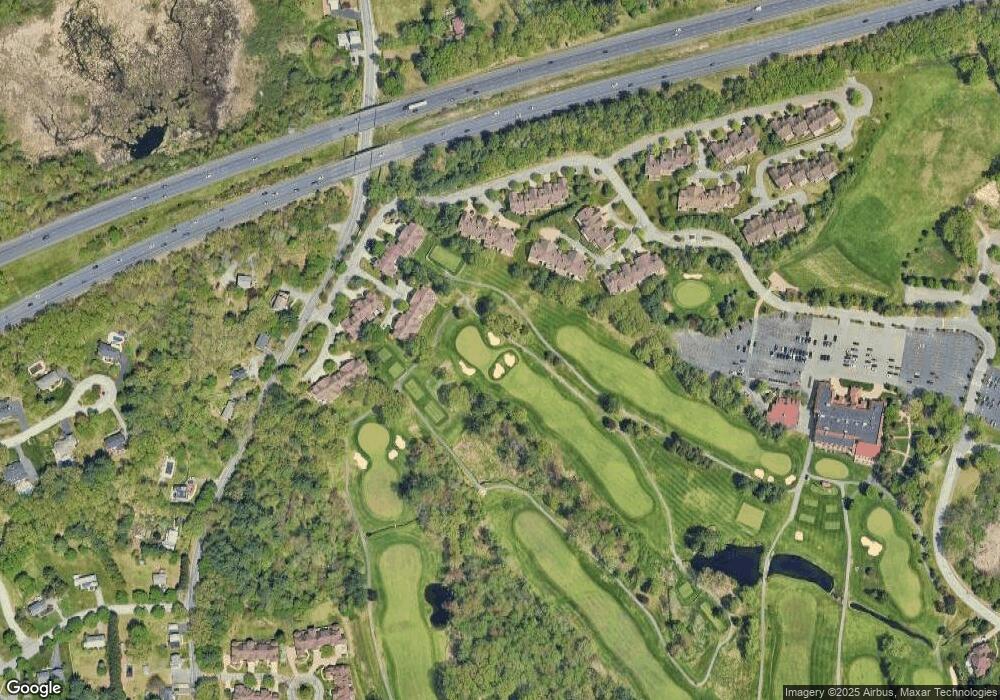
Map
Nearby Homes
- 21 Clubview Dr Unit 21
- 25 Clubview Dr Unit 25
- 29 Westchester Dr
- 0
- 10 Dartmouth Rd
- 20 Robert Dr Unit 20
- 58 Chandler Rd
- 5 Crestwood Cir
- 40 Chandler Cir
- 53 Martingale Ln
- 35 Adams St
- 34 Martingale Ln Unit 34
- 9 Oakland Rd
- 31 Crenshaw Ln Unit 31
- 102 Weare St
- 37 Crenshaw Ln Unit 37
- 4 Weeping Willow Dr
- 5 Weeping Willow Dr
- 2 Weeping Willow Dr
- 12B Stevens St
Your Personal Tour Guide
Ask me questions while you tour the home.