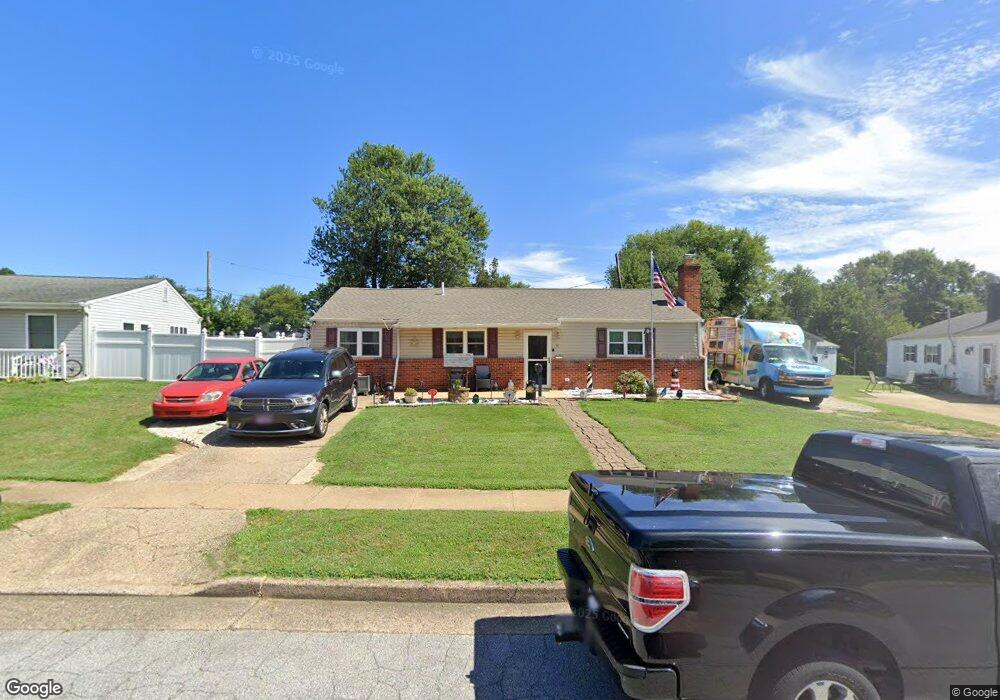
11 Tavernier Dr New Castle, DE 19720
Estimated Value: $245,000 - $308,000
3
Beds
1
Bath
1,175
Sq Ft
$241/Sq Ft
Est. Value
About This Home
This home is located at 11 Tavernier Dr, New Castle, DE 19720 and is currently estimated at $282,760, approximately $240 per square foot. 11 Tavernier Dr is a home located in New Castle County with nearby schools including Castle Hills Elementary School, Calvin R. McCullough Middle School, and Charter School of New Castle.
Ownership History
Date
Name
Owned For
Owner Type
Purchase Details
Closed on
Oct 14, 2016
Sold by
Klair Richard and Klair Corrina M
Bought by
Pyle Linda R and Pyle Rebecca L
Current Estimated Value
Home Financials for this Owner
Home Financials are based on the most recent Mortgage that was taken out on this home.
Original Mortgage
$8,000
Outstanding Balance
$6,422
Interest Rate
3.5%
Mortgage Type
Unknown
Estimated Equity
$276,338
Purchase Details
Closed on
May 5, 2006
Sold by
Spatz Randall D and Spatz Carol M
Bought by
Klair Richard and Klair Corrina M
Create a Home Valuation Report for This Property
The Home Valuation Report is an in-depth analysis detailing your home's value as well as a comparison with similar homes in the area
Home Values in the Area
Average Home Value in this Area
Purchase History
| Date | Buyer | Sale Price | Title Company |
|---|---|---|---|
| Pyle Linda R | $175,000 | None Available | |
| Klair Richard | $55,000 | None Available |
Source: Public Records
Mortgage History
| Date | Status | Borrower | Loan Amount |
|---|---|---|---|
| Open | Pyle Linda R | $8,000 | |
| Open | Pyle Linda R | $166,250 |
Source: Public Records
Tax History Compared to Growth
Tax History
| Year | Tax Paid | Tax Assessment Tax Assessment Total Assessment is a certain percentage of the fair market value that is determined by local assessors to be the total taxable value of land and additions on the property. | Land | Improvement |
|---|---|---|---|---|
| 2024 | $1,219 | $35,500 | $6,700 | $28,800 |
| 2023 | $1,108 | $35,500 | $6,700 | $28,800 |
| 2022 | $1,154 | $35,500 | $6,700 | $28,800 |
| 2021 | $1,154 | $35,500 | $6,700 | $28,800 |
| 2020 | $1,161 | $35,500 | $6,700 | $28,800 |
| 2019 | $1,346 | $35,500 | $6,700 | $28,800 |
| 2018 | $1,118 | $34,900 | $6,700 | $28,200 |
| 2017 | $1,046 | $34,900 | $6,700 | $28,200 |
| 2016 | $931 | $34,900 | $6,700 | $28,200 |
| 2015 | $936 | $34,900 | $6,700 | $28,200 |
| 2014 | $937 | $34,900 | $6,700 | $28,200 |
Source: Public Records
Map
Nearby Homes