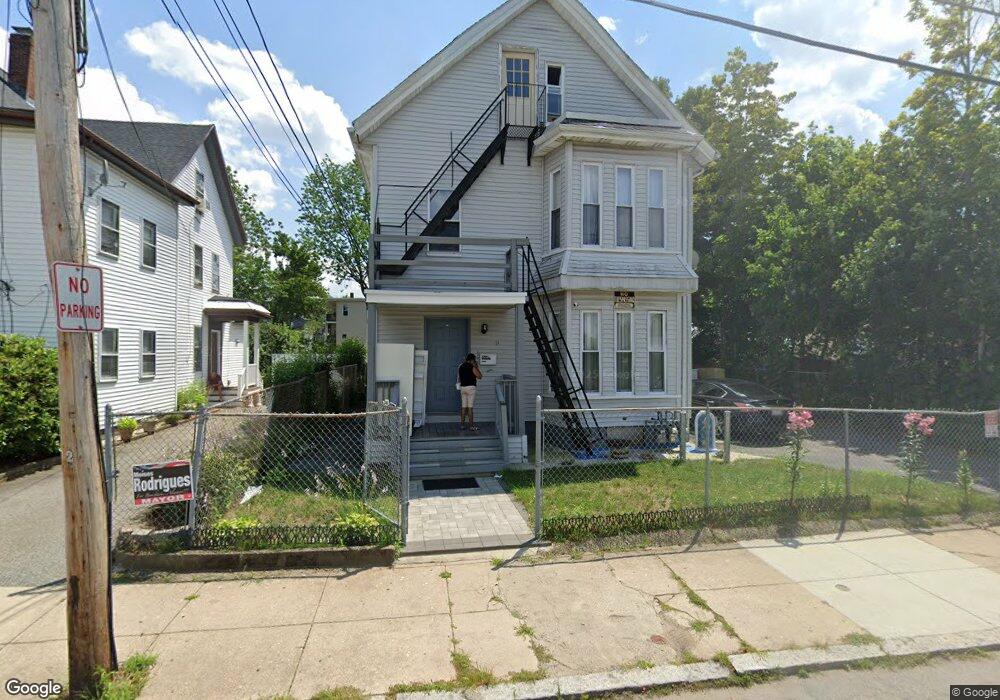
11 Temple St Brockton, MA 02301
Clifton Heights NeighborhoodEstimated Value: $649,597 - $823,000
8
Beds
3
Baths
3,246
Sq Ft
$235/Sq Ft
Est. Value
About This Home
This home is located at 11 Temple St, Brockton, MA 02301 and is currently estimated at $762,149, approximately $234 per square foot. 11 Temple St is a home located in Plymouth County with nearby schools including Gilmore Elementary School, Davis K-8 School, and John F. Kennedy Elementary School.
Ownership History
Date
Name
Owned For
Owner Type
Purchase Details
Closed on
Oct 22, 2019
Sold by
Berks Robert J
Bought by
Teixeira Isabel
Current Estimated Value
Home Financials for this Owner
Home Financials are based on the most recent Mortgage that was taken out on this home.
Original Mortgage
$286,500
Outstanding Balance
$250,434
Interest Rate
3.5%
Mortgage Type
New Conventional
Estimated Equity
$511,715
Purchase Details
Closed on
Oct 5, 2009
Sold by
Noel Elie
Bought by
Galvao Pedro and Teixeira Isabel
Home Financials for this Owner
Home Financials are based on the most recent Mortgage that was taken out on this home.
Original Mortgage
$206,196
Interest Rate
5.12%
Mortgage Type
Purchase Money Mortgage
Purchase Details
Closed on
May 13, 2004
Sold by
Sanon Marie
Bought by
Noel Elie
Purchase Details
Closed on
Jan 19, 2001
Sold by
Fernandes Luis F and Fernandes Ana G
Bought by
Sanon Marie
Purchase Details
Closed on
Oct 16, 1995
Sold by
Longworth Inc
Bought by
Miranda Francisco and Fernandes Luis
Create a Home Valuation Report for This Property
The Home Valuation Report is an in-depth analysis detailing your home's value as well as a comparison with similar homes in the area
Home Values in the Area
Average Home Value in this Area
Purchase History
| Date | Buyer | Sale Price | Title Company |
|---|---|---|---|
| Teixeira Isabel | $427,500 | -- | |
| Galvao Pedro | $210,000 | -- | |
| Noel Elie | $374,900 | -- | |
| Sanon Marie | $190,000 | -- | |
| Miranda Francisco | $17,500 | -- |
Source: Public Records
Mortgage History
| Date | Status | Borrower | Loan Amount |
|---|---|---|---|
| Open | Teixeira Isabel | $286,500 | |
| Previous Owner | Miranda Francisco | $206,196 | |
| Previous Owner | Miranda Francisco | $2,500 |
Source: Public Records
Tax History
| Year | Tax Paid | Tax Assessment Tax Assessment Total Assessment is a certain percentage of the fair market value that is determined by local assessors to be the total taxable value of land and additions on the property. | Land | Improvement |
|---|---|---|---|---|
| 2025 | $8,254 | $681,600 | $140,000 | $541,600 |
| 2024 | $7,631 | $634,900 | $140,000 | $494,900 |
| 2023 | $7,535 | $580,500 | $104,100 | $476,400 |
| 2022 | $7,098 | $508,100 | $94,600 | $413,500 |
| 2021 | $6,508 | $448,800 | $78,500 | $370,300 |
| 2020 | $5,587 | $368,800 | $73,600 | $295,200 |
| 2019 | $5,720 | $368,100 | $71,800 | $296,300 |
| 2018 | $7,385 | $300,100 | $71,800 | $228,300 |
| 2017 | $4,774 | $296,500 | $71,800 | $224,700 |
| 2016 | $3,970 | $228,700 | $69,600 | $159,100 |
| 2015 | $3,425 | $188,700 | $69,600 | $119,100 |
| 2014 | $3,381 | $186,500 | $69,600 | $116,900 |
Source: Public Records
Map
Nearby Homes
Your Personal Tour Guide
Ask me questions while you tour the home.