Estimated Value: $596,000 - $847,000
1
Bed
2
Baths
2,001
Sq Ft
$352/Sq Ft
Est. Value
About This Home
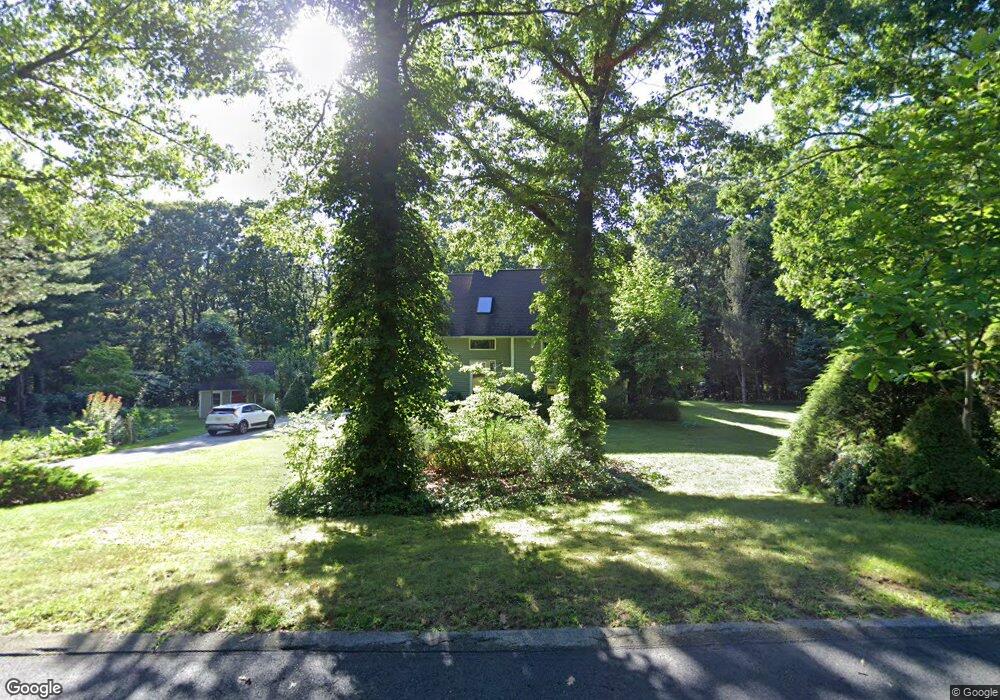
This home is located at 11 Thayer St, Upton, MA 01568 and is currently estimated at $703,655, approximately $351 per square foot. 11 Thayer St is a home located in Worcester County with nearby schools including Nipmuc Regional High School and Touchstone Community School.
Ownership History
Date
Name
Owned For
Owner Type
Purchase Details
Closed on
Mar 24, 2023
Sold by
Hart Dennis R and Smyth Thomas R
Bought by
Hart-Smyth Ft
Current Estimated Value
Purchase Details
Closed on
Sep 20, 1996
Sold by
Miller Lance R and Miller Francesca S
Bought by
Hart Dennis R and Smyth Thomas
Home Financials for this Owner
Home Financials are based on the most recent Mortgage that was taken out on this home.
Original Mortgage
$167,200
Interest Rate
7.89%
Mortgage Type
Purchase Money Mortgage
Purchase Details
Closed on
Oct 1, 1993
Sold by
Guha Subrata and Guha Laura
Bought by
Miller Lance R and Miller Francesca S
Home Financials for this Owner
Home Financials are based on the most recent Mortgage that was taken out on this home.
Original Mortgage
$183,000
Interest Rate
7%
Mortgage Type
Purchase Money Mortgage
Create a Home Valuation Report for This Property
The Home Valuation Report is an in-depth analysis detailing your home's value as well as a comparison with similar homes in the area
Home Values in the Area
Average Home Value in this Area
Purchase History
| Date | Buyer | Sale Price | Title Company |
|---|---|---|---|
| Hart-Smyth Ft | -- | None Available | |
| Hart Dennis R | $209,000 | -- | |
| Miller Lance R | $185,000 | -- |
Source: Public Records
Mortgage History
| Date | Status | Borrower | Loan Amount |
|---|---|---|---|
| Previous Owner | Miller Lance R | $70,000 | |
| Previous Owner | Miller Lance R | $164,400 | |
| Previous Owner | Miller Lance R | $167,200 | |
| Previous Owner | Miller Lance R | $183,000 |
Source: Public Records
Tax History
| Year | Tax Paid | Tax Assessment Tax Assessment Total Assessment is a certain percentage of the fair market value that is determined by local assessors to be the total taxable value of land and additions on the property. | Land | Improvement |
|---|---|---|---|---|
| 2025 | $6,700 | $509,500 | $287,600 | $221,900 |
| 2024 | $6,666 | $487,300 | $279,600 | $207,700 |
| 2023 | $5,701 | $411,000 | $199,700 | $211,300 |
| 2022 | $6,859 | $409,000 | $199,700 | $209,300 |
| 2021 | $7,165 | $431,600 | $243,700 | $187,900 |
| 2020 | $7,253 | $421,200 | $231,700 | $189,500 |
| 2019 | $6,855 | $396,000 | $201,300 | $194,700 |
| 2018 | $6,628 | $384,700 | $209,300 | $175,400 |
| 2017 | $6,979 | $384,300 | $205,300 | $179,000 |
| 2016 | $6,104 | $328,900 | $159,800 | $169,100 |
| 2015 | $5,761 | $339,900 | $159,800 | $180,100 |
| 2014 | $5,665 | $334,200 | $151,800 | $182,400 |
Source: Public Records
Map
Nearby Homes
- 300 W Main St
- 11 East St
- 10 Andrea Dr
- 29 Cider Mill Ln
- 46 Rockwood Ln Unit 46
- 130 High St
- 12 Boot Shop Rd Unit 37
- 18 Boot Shop Rd Unit 40
- 31 Elm St
- 5 Boot Shop Rd Unit 31
- 6 Chickadee Way Unit 23
- 220 Pond St
- 10 Queen Anne Rd
- 15 Shoemaker Ln Unit 7
- 17 N Main St
- 2 Country Way
- 7 Fieldstone Dr Unit 7
- 6 Fieldstone Dr Unit 6
- 15 Yale Rd
- 186 Spring St
Your Personal Tour Guide
Ask me questions while you tour the home.