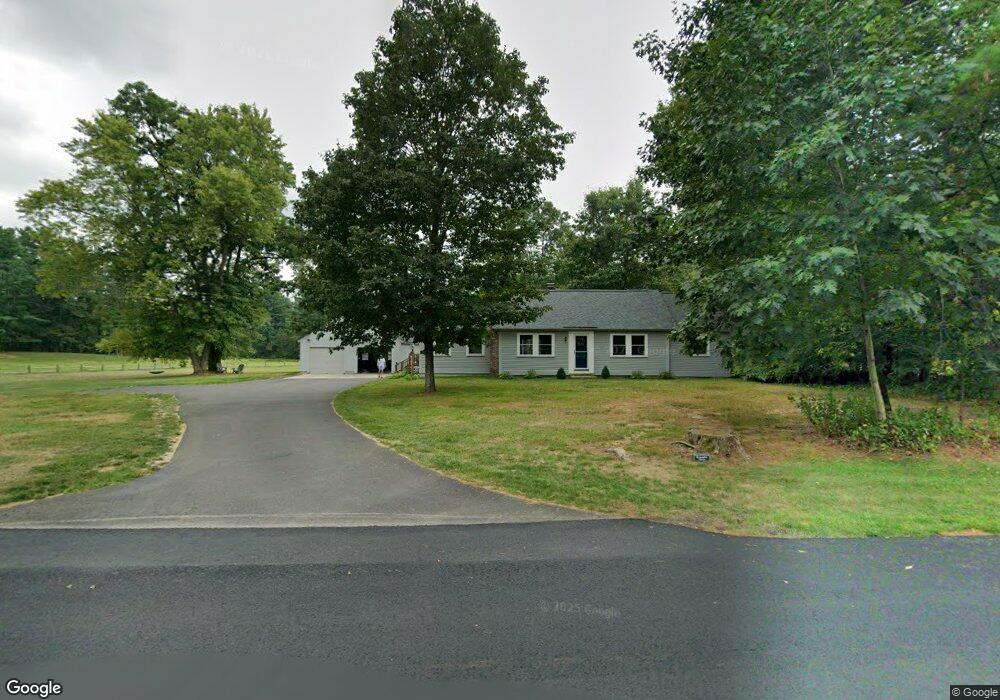
11 Thornton Ferry Road I Amherst, NH 03031
Estimated Value: $532,000 - $631,000
3
Beds
2
Baths
1,828
Sq Ft
$313/Sq Ft
Est. Value
About This Home
This home is located at 11 Thornton Ferry Road I, Amherst, NH 03031 and is currently estimated at $571,616, approximately $312 per square foot. 11 Thornton Ferry Road I is a home with nearby schools including Wilkins Elementary School, Amherst Middle School, and Souhegan Cooperative High School.
Ownership History
Date
Name
Owned For
Owner Type
Purchase Details
Closed on
Jan 8, 2025
Sold by
Hujsak Cassandra
Bought by
Cassandra Hujsak Lt and Hujsak
Current Estimated Value
Purchase Details
Closed on
Apr 20, 2018
Sold by
Potter Seth C
Bought by
Seth C Potter Ret
Create a Home Valuation Report for This Property
The Home Valuation Report is an in-depth analysis detailing your home's value as well as a comparison with similar homes in the area
Home Values in the Area
Average Home Value in this Area
Purchase History
| Date | Buyer | Sale Price | Title Company |
|---|---|---|---|
| Cassandra Hujsak Lt | -- | None Available | |
| Cassandra Hujsak Lt | -- | None Available | |
| Seth C Potter Ret | -- | -- | |
| Seth C Potter Ret | -- | -- | |
| Seth C Potter Ret | -- | -- |
Source: Public Records
Tax History Compared to Growth
Tax History
| Year | Tax Paid | Tax Assessment Tax Assessment Total Assessment is a certain percentage of the fair market value that is determined by local assessors to be the total taxable value of land and additions on the property. | Land | Improvement |
|---|---|---|---|---|
| 2024 | $8,032 | $350,300 | $142,900 | $207,400 |
| 2023 | $7,665 | $350,300 | $142,900 | $207,400 |
| 2022 | $7,402 | $350,300 | $142,900 | $207,400 |
| 2021 | $7,465 | $350,300 | $142,900 | $207,400 |
| 2020 | $7,228 | $253,800 | $114,300 | $139,500 |
| 2019 | $6,842 | $253,800 | $114,300 | $139,500 |
| 2018 | $6,911 | $253,800 | $114,300 | $139,500 |
| 2017 | $6,263 | $253,800 | $114,300 | $139,500 |
| 2016 | $6,370 | $253,800 | $114,300 | $139,500 |
| 2015 | $6,202 | $234,200 | $123,700 | $110,500 |
| 2014 | $6,244 | $234,200 | $123,700 | $110,500 |
| 2013 | $6,195 | $234,200 | $123,700 | $110,500 |
Source: Public Records
Map
Nearby Homes
- 6 Whittemore Ln
- 25 Atherton Ln
- 135 Amherst St Unit 28
- 9 Northfield Rd
- 7 Miles Rd
- 1A Debbie Ln
- 37 Baboosic Lake Rd
- 7 Corduroy Rd Unit 20
- 18 Storybrook Ln
- 16 Storybrook Ln
- 4 Bloody Brook Rd
- 23 Bloody Brook Rd
- 3 Beechtree Way
- 0 Claude Rd
- 7 Fox Run Rd
- 1B Debbie Ln
- 67 Christian Hill Rd
- 3 Renee Dr
- 40 North St
- 4 County Rd
- 6 Thornton Ferry Road I
- 8 Thornton Ferry Road I
- 17 Thornton Ferry Road I
- 17 Thornton Ferry Road I
- 14 Thornton Ferry Road I
- 6 Courthouse Rd
- 6 Courthouse Rd
- 3 Thornton Ferry Road I
- 40 Courthouse Rd
- 38 Courthouse Rd
- 42 Courthouse Rd
- 41 Courthouse Rd
- 5 Thatcher Dr
- 1 Thornton Ferry Road I
- 44 Courthouse Rd
- 24 Courthouse Rd
- 3 Thatcher Dr
- 46 Courthouse Rd
- 7 Thatcher Dr
- 35 Courthouse Rd