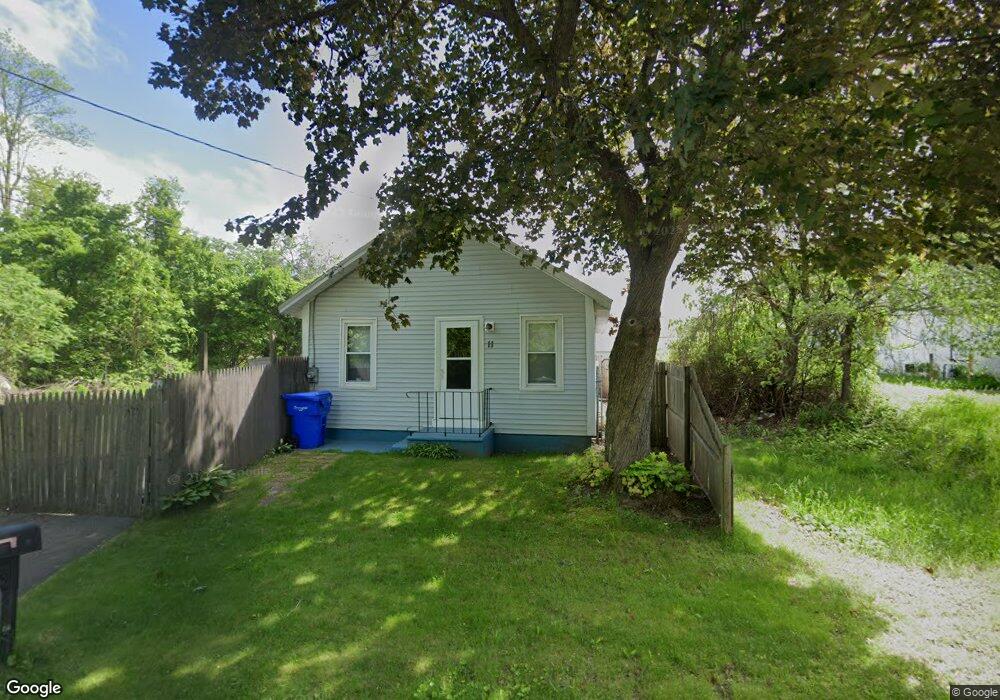
11 Tilton St Springfield, MA 01109
Pine Point NeighborhoodEstimated Value: $200,000 - $289,000
2
Beds
1
Bath
875
Sq Ft
$274/Sq Ft
Est. Value
About This Home
This home is located at 11 Tilton St, Springfield, MA 01109 and is currently estimated at $239,347, approximately $273 per square foot. 11 Tilton St is a home located in Hampden County with nearby schools including John F. Kennedy Academy, Springfield Central High School, and Roger L. Putnam Vocational Technical Academy.
Ownership History
Date
Name
Owned For
Owner Type
Purchase Details
Closed on
Oct 22, 2019
Sold by
Levesque Faith M
Bought by
Have Faith T
Current Estimated Value
Purchase Details
Closed on
May 3, 2006
Sold by
Young James B
Bought by
Levesque Faith M
Purchase Details
Closed on
Sep 16, 1994
Sold by
Conn River Vly Corp
Bought by
Young James B
Purchase Details
Closed on
Oct 13, 1993
Sold by
Delacruz Hector
Bought by
Conn River Vly Corp
Purchase Details
Closed on
Aug 31, 1987
Sold by
Bolduc George A
Bought by
Delacruz Hector
Home Financials for this Owner
Home Financials are based on the most recent Mortgage that was taken out on this home.
Original Mortgage
$66,400
Interest Rate
10.24%
Mortgage Type
Purchase Money Mortgage
Create a Home Valuation Report for This Property
The Home Valuation Report is an in-depth analysis detailing your home's value as well as a comparison with similar homes in the area
Home Values in the Area
Average Home Value in this Area
Purchase History
| Date | Buyer | Sale Price | Title Company |
|---|---|---|---|
| Have Faith T | -- | -- | |
| Levesque Faith M | $110,000 | -- | |
| Young James B | $20,400 | -- | |
| Conn River Vly Corp | $35,000 | -- | |
| Delacruz Hector | $69,900 | -- |
Source: Public Records
Mortgage History
| Date | Status | Borrower | Loan Amount |
|---|---|---|---|
| Previous Owner | Delacruz Hector | $66,516 | |
| Previous Owner | Delacruz Hector | $32,900 | |
| Previous Owner | Delacruz Hector | $10,132 | |
| Previous Owner | Delacruz Hector | $66,400 |
Source: Public Records
Tax History Compared to Growth
Tax History
| Year | Tax Paid | Tax Assessment Tax Assessment Total Assessment is a certain percentage of the fair market value that is determined by local assessors to be the total taxable value of land and additions on the property. | Land | Improvement |
|---|---|---|---|---|
| 2025 | $2,815 | $179,500 | $36,600 | $142,900 |
| 2024 | $2,648 | $164,900 | $30,500 | $134,400 |
| 2023 | $2,726 | $159,900 | $27,700 | $132,200 |
| 2022 | $2,132 | $113,300 | $25,900 | $87,400 |
| 2021 | $2,215 | $117,200 | $23,500 | $93,700 |
| 2020 | $2,285 | $117,000 | $23,500 | $93,500 |
| 2019 | $2,047 | $104,000 | $23,500 | $80,500 |
| 2018 | $1,844 | $93,700 | $23,500 | $70,200 |
| 2017 | $1,850 | $94,100 | $21,800 | $72,300 |
| 2016 | $1,724 | $87,700 | $21,800 | $65,900 |
| 2015 | $1,680 | $85,400 | $21,800 | $63,600 |
Source: Public Records
Map
Nearby Homes