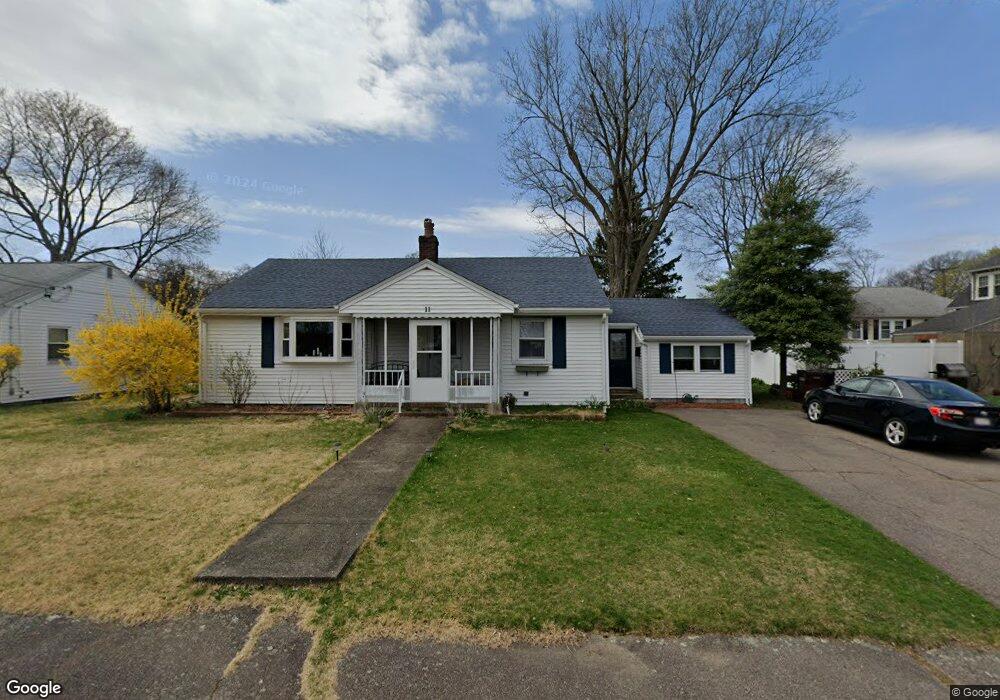
11 Tower St Dedham, MA 02026
The Manor NeighborhoodEstimated Value: $632,465 - $691,000
2
Beds
1
Bath
1,216
Sq Ft
$540/Sq Ft
Est. Value
About This Home
This home is located at 11 Tower St, Dedham, MA 02026 and is currently estimated at $656,616, approximately $539 per square foot. 11 Tower St is a home located in Norfolk County with nearby schools including Greenlodge Elementary School, Dedham Middle School, and Dedham High School.
Ownership History
Date
Name
Owned For
Owner Type
Purchase Details
Closed on
Apr 30, 1990
Sold by
Kurilecz Joseph
Bought by
Withrow Robert E
Current Estimated Value
Purchase Details
Closed on
Jul 11, 1988
Sold by
Pecher Robert L
Bought by
Kurilecz Joseph M
Create a Home Valuation Report for This Property
The Home Valuation Report is an in-depth analysis detailing your home's value as well as a comparison with similar homes in the area
Home Values in the Area
Average Home Value in this Area
Purchase History
| Date | Buyer | Sale Price | Title Company |
|---|---|---|---|
| Withrow Robert E | $158,000 | -- | |
| Kurilecz Joseph M | $155,000 | -- |
Source: Public Records
Mortgage History
| Date | Status | Borrower | Loan Amount |
|---|---|---|---|
| Open | Kurilecz Joseph M | $285,000 | |
| Closed | Kurilecz Joseph M | $166,830 | |
| Closed | Kurilecz Joseph M | $153,000 |
Source: Public Records
Tax History
| Year | Tax Paid | Tax Assessment Tax Assessment Total Assessment is a certain percentage of the fair market value that is determined by local assessors to be the total taxable value of land and additions on the property. | Land | Improvement |
|---|---|---|---|---|
| 2025 | $7,188 | $569,600 | $331,700 | $237,900 |
| 2024 | $6,819 | $545,500 | $300,900 | $244,600 |
| 2023 | $6,424 | $500,300 | $272,500 | $227,800 |
| 2022 | $6,076 | $455,100 | $255,900 | $199,200 |
| 2021 | $5,767 | $421,900 | $236,900 | $185,000 |
| 2020 | $5,676 | $413,700 | $236,900 | $176,800 |
| 2019 | $5,410 | $382,300 | $206,000 | $176,300 |
| 2018 | $5,015 | $344,700 | $181,000 | $163,700 |
| 2017 | $4,920 | $333,300 | $169,600 | $163,700 |
| 2016 | $5,003 | $323,000 | $157,000 | $166,000 |
| 2015 | $4,937 | $311,100 | $154,100 | $157,000 |
| 2014 | $4,702 | $292,400 | $151,200 | $141,200 |
Source: Public Records
Map
Nearby Homes
- 50 Sprague St
- 45 Circuit Rd
- 926 East St
- 22 Azalea Cir
- 59 Hamilton Ave
- 18 Greensboro Rd
- 98 Cedar St Unit 2
- 12 Blossom St
- 391 Sprague St
- 397 Sprague St
- 44 Holmes Rd
- 6 Snow Ln
- 600 East St
- 51 Lancaster Rd
- 2 Leominster Rd
- 88 Durham Rd
- 86 Durham Rd
- 7 S Stone Mill Dr Unit 403
- 1905 River St Unit 1905
- 13 W Milton Place
Your Personal Tour Guide
Ask me questions while you tour the home.