11 Triangle St Danbury, CT 06810
Danbury AreaEstimated Value: $441,747 - $599,000
About This Home
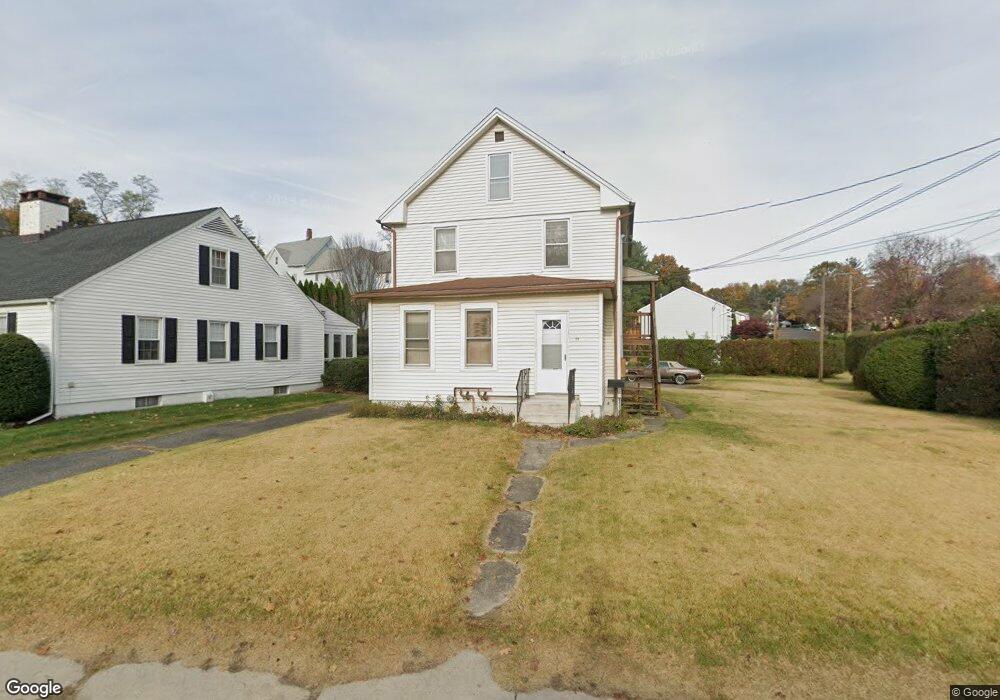
This home is located at 11 Triangle St, Danbury, CT 06810 and is currently estimated at $509,437, approximately $265 per square foot. 11 Triangle St is a home located in Fairfield County with nearby schools including South Street School, Rogers Park Middle School, and Danbury High School.
Ownership History
We collect this data history from publicly available records. To have your information removed, we recommend requesting removal directly through your county’s website.
Purchase Details
Home Values in the Area
Average Home Value in this Area
Purchase History
We collect this data history from publicly available records. To have your information removed, we recommend requesting removal directly through your county’s website.
| Date | Buyer | Sale Price | Title Company |
|---|---|---|---|
| $135,000 | -- |
Tax History
We collect this data history from publicly available records. To have your information removed, we recommend requesting removal directly through your county’s website.
| Year | Tax Paid | Tax Assessment Tax Assessment Total Assessment is a certain percentage of the fair market value that is determined by local assessors to be the total taxable value of land and additions on the property. | Land | Improvement |
|---|---|---|---|---|
| 2025 | $6,151 | $246,120 | $71,260 | $174,860 |
| 2024 | $6,015 | $246,120 | $71,260 | $174,860 |
| 2023 | $5,742 | $246,120 | $71,260 | $174,860 |
| 2022 | $4,885 | $173,100 | $58,700 | $114,400 |
| 2021 | $4,778 | $173,100 | $58,700 | $114,400 |
| 2020 | $4,778 | $173,100 | $58,700 | $114,400 |
| 2019 | $4,778 | $173,100 | $58,700 | $114,400 |
| 2018 | $4,778 | $173,100 | $58,700 | $114,400 |
| 2017 | $3,862 | $133,400 | $55,900 | $77,500 |
| 2016 | $3,826 | $133,400 | $55,900 | $77,500 |
| 2015 | $3,770 | $133,400 | $55,900 | $77,500 |
| 2014 | $3,682 | $133,400 | $55,900 | $77,500 |
Map
- 11 Stone St
- 29 Town Hill Ave Unit 7
- 94 South St
- 41 Town Hill Ave
- 4 Francis Rd
- 16 Mcdermott St
- 1 Fairfield Ave Unit 3
- 35 Taylor St
- 37 Taylor St
- 14 Morton St
- 126 Triangle St Unit B13
- 126 Triangle St Unit A16
- 31-33 Wildman St
- 30 Wildman St
- 6 Robinview Terrace
- 16 Seeley St
- 124-130 Deer Hill Ave Unit 20
- 15-17 Boughton St Unit 1-1
- 15-17 Boughton St Unit 4
- 34 Patriot Dr Unit A6
Ask me questions while you tour the home.