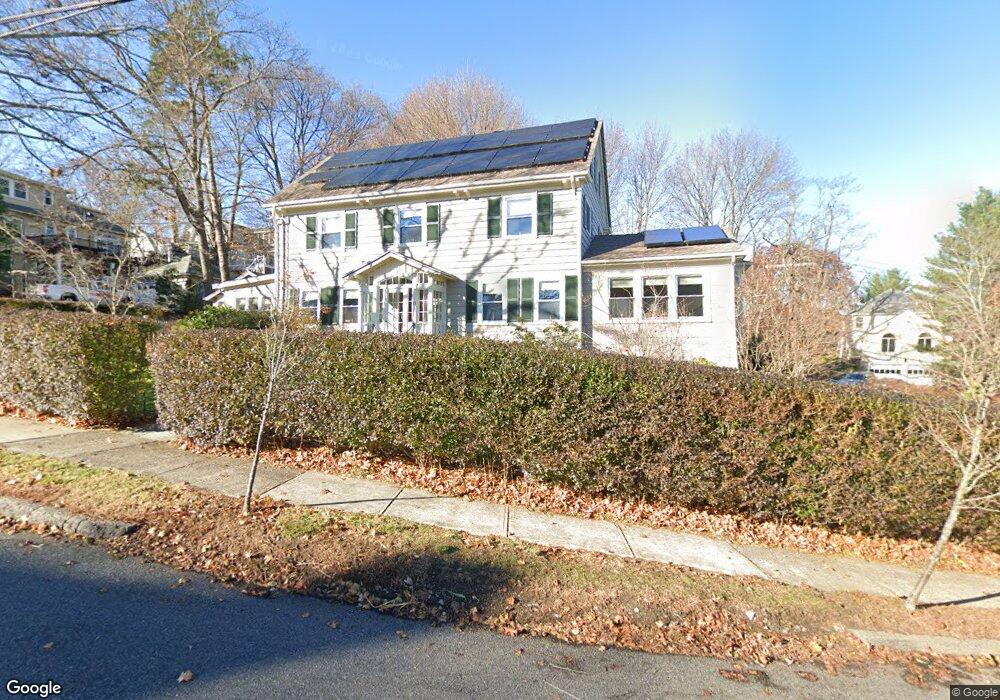
11 Upland Rd Arlington, MA 02474
Arlington Center NeighborhoodEstimated Value: $1,381,000 - $1,697,000
4
Beds
2
Baths
2,676
Sq Ft
$598/Sq Ft
Est. Value
About This Home
This home is located at 11 Upland Rd, Arlington, MA 02474 and is currently estimated at $1,600,741, approximately $598 per square foot. 11 Upland Rd is a home located in Middlesex County with nearby schools including Bishop Elementary School, Ottoson Middle School, and Arlington High School.
Ownership History
Date
Name
Owned For
Owner Type
Purchase Details
Closed on
Apr 28, 2022
Sold by
Gramm Anna C and Mau Bryan W
Bought by
Gramm-Mau Ret and Mau
Current Estimated Value
Purchase Details
Closed on
May 21, 1999
Sold by
Bergantino Jennifer E
Bought by
Mau Bryan W and Gramm Anna C
Home Financials for this Owner
Home Financials are based on the most recent Mortgage that was taken out on this home.
Original Mortgage
$412,000
Interest Rate
6.88%
Mortgage Type
Purchase Money Mortgage
Purchase Details
Closed on
Jan 18, 1991
Sold by
Mccarthy John R
Bought by
Bergantino Paul V and Johnson Jennifer E
Create a Home Valuation Report for This Property
The Home Valuation Report is an in-depth analysis detailing your home's value as well as a comparison with similar homes in the area
Home Values in the Area
Average Home Value in this Area
Purchase History
| Date | Buyer | Sale Price | Title Company |
|---|---|---|---|
| Gramm-Mau Ret | -- | None Available | |
| Mau Bryan W | $515,000 | -- | |
| Bergantino Paul V | $230,000 | -- |
Source: Public Records
Mortgage History
| Date | Status | Borrower | Loan Amount |
|---|---|---|---|
| Previous Owner | Bergantino Paul V | $417,000 | |
| Previous Owner | Bergantino Paul V | $412,000 |
Source: Public Records
Tax History Compared to Growth
Tax History
| Year | Tax Paid | Tax Assessment Tax Assessment Total Assessment is a certain percentage of the fair market value that is determined by local assessors to be the total taxable value of land and additions on the property. | Land | Improvement |
|---|---|---|---|---|
| 2025 | $16,858 | $1,565,300 | $714,800 | $850,500 |
| 2024 | $15,889 | $1,500,400 | $714,800 | $785,600 |
| 2023 | $14,951 | $1,333,700 | $615,100 | $718,600 |
| 2022 | $14,058 | $1,231,000 | $581,800 | $649,200 |
| 2021 | $13,728 | $1,210,600 | $581,800 | $628,800 |
| 2020 | $12,711 | $1,149,300 | $581,800 | $567,500 |
| 2019 | $11,328 | $1,006,000 | $581,800 | $424,200 |
| 2018 | $11,195 | $922,900 | $498,700 | $424,200 |
| 2017 | $11,175 | $889,700 | $465,500 | $424,200 |
| 2016 | $10,537 | $823,200 | $399,000 | $424,200 |
| 2015 | $10,444 | $770,800 | $357,400 | $413,400 |
Source: Public Records
Map
Nearby Homes
- 335 Mystic St
- 10 Apache Trail
- 12 Longmeadow Rd
- 5 Wood Ln
- 5A Wood Ln
- 3 Victoria Rd Unit 3
- 3 Victoria Rd Unit 5
- 37 Pine St
- 211 Grove St
- 5 Norwich Cir
- 97 Mystic St Unit B
- 7 Court Street Place Unit 7
- 52-56 Dudley St
- 7 Mill St Unit 7
- 0 Jerome St Unit 72734260
- 6 Pawnee Dr
- 51 Sagamore Ave
- 12 Canterbury Rd
- 167 Franklin St Unit 167
- 975 Mass Ave Unit 106