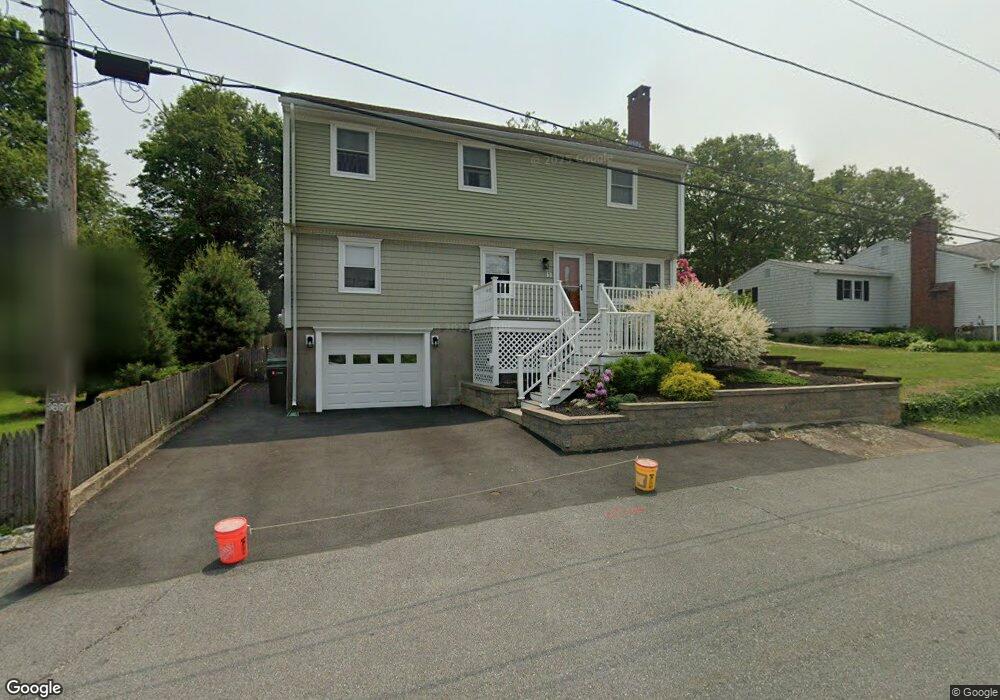
11 Verdon St Salem, MA 01970
Witchcraft Heights NeighborhoodEstimated Value: $726,120 - $916,000
4
Beds
4
Baths
2,400
Sq Ft
$337/Sq Ft
Est. Value
About This Home
This home is located at 11 Verdon St, Salem, MA 01970 and is currently estimated at $809,530, approximately $337 per square foot. 11 Verdon St is a home located in Essex County with nearby schools including Horace Mann Laboratory, Witchcraft Heights Elementary School, and Saltonstall School.
Ownership History
Date
Name
Owned For
Owner Type
Purchase Details
Closed on
Jun 15, 2009
Sold by
Birmingham Matthew G and Birmingham Sheri L
Bought by
Revoy Richard and Capone Susan
Current Estimated Value
Home Financials for this Owner
Home Financials are based on the most recent Mortgage that was taken out on this home.
Original Mortgage
$318,400
Outstanding Balance
$201,711
Interest Rate
4.82%
Mortgage Type
Purchase Money Mortgage
Estimated Equity
$607,819
Purchase Details
Closed on
Mar 30, 2007
Sold by
Speliotis James P
Bought by
Birmingham Matthew G
Home Financials for this Owner
Home Financials are based on the most recent Mortgage that was taken out on this home.
Original Mortgage
$228,000
Interest Rate
6.33%
Mortgage Type
Purchase Money Mortgage
Create a Home Valuation Report for This Property
The Home Valuation Report is an in-depth analysis detailing your home's value as well as a comparison with similar homes in the area
Home Values in the Area
Average Home Value in this Area
Purchase History
| Date | Buyer | Sale Price | Title Company |
|---|---|---|---|
| Revoy Richard | $398,000 | -- | |
| Birmingham Matthew G | $285,000 | -- | |
| Speliotis George P | -- | -- |
Source: Public Records
Mortgage History
| Date | Status | Borrower | Loan Amount |
|---|---|---|---|
| Open | Revoy Richard | $318,400 | |
| Previous Owner | Birmingham Matthew G | $228,000 |
Source: Public Records
Tax History Compared to Growth
Tax History
| Year | Tax Paid | Tax Assessment Tax Assessment Total Assessment is a certain percentage of the fair market value that is determined by local assessors to be the total taxable value of land and additions on the property. | Land | Improvement |
|---|---|---|---|---|
| 2025 | $7,194 | $634,400 | $190,800 | $443,600 |
| 2024 | $7,113 | $612,100 | $190,800 | $421,300 |
| 2023 | $6,760 | $540,400 | $174,700 | $365,700 |
| 2022 | $6,409 | $483,700 | $168,200 | $315,500 |
| 2021 | $6,605 | $478,600 | $168,200 | $310,400 |
| 2020 | $6,396 | $442,600 | $158,500 | $284,100 |
| 2019 | $6,297 | $417,000 | $150,700 | $266,300 |
| 2018 | $6,124 | $398,200 | $143,600 | $254,600 |
| 2017 | $6,060 | $382,100 | $135,900 | $246,200 |
| 2016 | $5,734 | $365,900 | $119,700 | $246,200 |
| 2015 | $5,478 | $333,800 | $110,000 | $223,800 |
Source: Public Records
Map
Nearby Homes
- 54 Cavendish Cir
- 2 Sophia Rd
- 18 Appleby Rd
- 7 Hibernia Ln
- 16 Whalers Ln Unit 16
- 32 Whalers Ln Unit C
- 16 Appleby Rd
- 22 Celestial Way
- 13 Bengal Ln
- 12 Tanglewood Ln Unit 12
- 6 Countryside Ln Unit 1303
- 17 Lions Ln
- 16 Admirals Ln Unit 16
- 19 Clark St
- 6 Orient Way Unit 28A
- 11 Woodlands Rd
- 5 Willson Rd
- 8 Wyman Ave
- 20 State St
- 13 State St