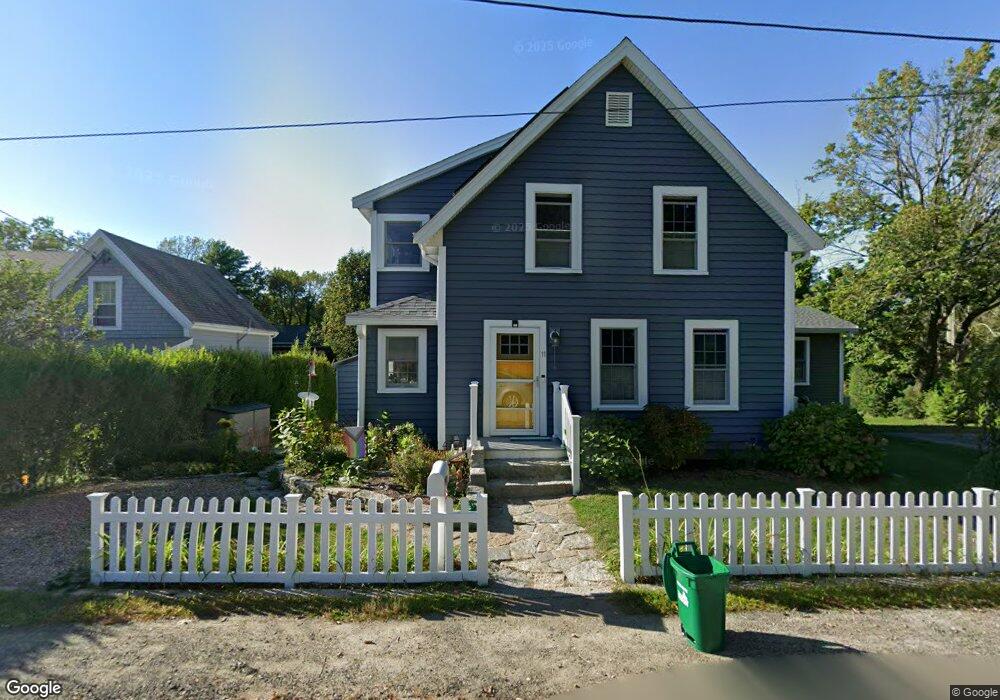
11 Vulcan St Gloucester, MA 01930
Estimated Value: $734,000 - $1,206,000
3
Beds
2
Baths
1,773
Sq Ft
$549/Sq Ft
Est. Value
About This Home
This home is located at 11 Vulcan St, Gloucester, MA 01930 and is currently estimated at $973,917, approximately $549 per square foot. 11 Vulcan St is a home located in Essex County with nearby schools including Plum Cove School, Ralph B O'maley Middle School, and Gloucester High School.
Ownership History
Date
Name
Owned For
Owner Type
Purchase Details
Closed on
Aug 6, 2021
Sold by
Hutchinson Kevin W and Mclear Kathy M
Bought by
Hutchinson Mclear Ft and Hutchinson
Current Estimated Value
Purchase Details
Closed on
Mar 29, 2021
Sold by
Hutchinson Mclear Ft and Hutchinson
Bought by
Hutchinson Kevin W and Mclear Kathy M
Purchase Details
Closed on
Feb 22, 2017
Sold by
Hutchinson Kevin W and Mclear Kathy M
Bought by
Hutchinson Kevin W and Mclear Kathy M
Purchase Details
Closed on
Sep 26, 2002
Sold by
Emmert Amy E
Bought by
Hutchinson Kevin W and Mclear Kathy M
Home Financials for this Owner
Home Financials are based on the most recent Mortgage that was taken out on this home.
Original Mortgage
$360,000
Interest Rate
6.25%
Mortgage Type
Purchase Money Mortgage
Purchase Details
Closed on
Jun 28, 2000
Sold by
Pino Ruth E and Pino Richard B
Bought by
Emmert Amy E
Create a Home Valuation Report for This Property
The Home Valuation Report is an in-depth analysis detailing your home's value as well as a comparison with similar homes in the area
Purchase History
| Date | Buyer | Sale Price | Title Company |
|---|---|---|---|
| Hutchinson Mclear Ft | -- | None Available | |
| Hutchinson Kevin W | -- | None Available | |
| Hutchinson Kevin W | -- | -- | |
| Hutchinson Kevin W | $360,000 | -- | |
| Emmert Amy E | $289,000 | -- |
Source: Public Records
Mortgage History
| Date | Status | Borrower | Loan Amount |
|---|---|---|---|
| Previous Owner | Emmert Amy E | $305,000 | |
| Previous Owner | Emmert Amy E | $248,700 | |
| Previous Owner | Emmert Amy E | $360,000 |
Source: Public Records
Tax History
| Year | Tax Paid | Tax Assessment Tax Assessment Total Assessment is a certain percentage of the fair market value that is determined by local assessors to be the total taxable value of land and additions on the property. | Land | Improvement |
|---|---|---|---|---|
| 2025 | $7,180 | $738,700 | $250,500 | $488,200 |
| 2024 | $7,072 | $726,800 | $238,600 | $488,200 |
| 2023 | $6,774 | $639,700 | $213,000 | $426,700 |
| 2022 | $6,511 | $555,100 | $181,100 | $374,000 |
| 2021 | $6,240 | $501,600 | $164,600 | $337,000 |
| 2020 | $6,181 | $501,300 | $164,600 | $336,700 |
| 2019 | $5,905 | $465,300 | $164,600 | $300,700 |
| 2018 | $5,694 | $440,400 | $164,600 | $275,800 |
| 2017 | $5,516 | $418,200 | $156,800 | $261,400 |
| 2016 | $5,441 | $399,800 | $157,300 | $242,500 |
| 2015 | $5,202 | $381,100 | $157,300 | $223,800 |
Source: Public Records
Map
Nearby Homes
- 10 Emerald St
- 43 High St Unit B
- 9 Hickory St
- 1030 Washington St
- 4 Ciaramitaro Ct
- 136 Leonard St
- 94 Phillips Ave
- 13 Phillips Ave
- 32 Haven Ave
- 33 Quarry Ridge Ln Unit 33
- 5 Boulder Top
- 13 Rowe Point
- 5 Smith St Unit R
- 672 Washington St
- 1 Charte Ct
- 1 Jewett St Unit 2
- 1 Main St Unit R
- 1 Main St Unit C
- 177 Main St
- 1 High St
Your Personal Tour Guide
Ask me questions while you tour the home.