11 W 39th St Savannah, GA 31401
Metropolitan NeighborhoodEstimated Value: $287,191 - $361,000
2
Beds
1
Bath
1,062
Sq Ft
$304/Sq Ft
Est. Value
About This Home
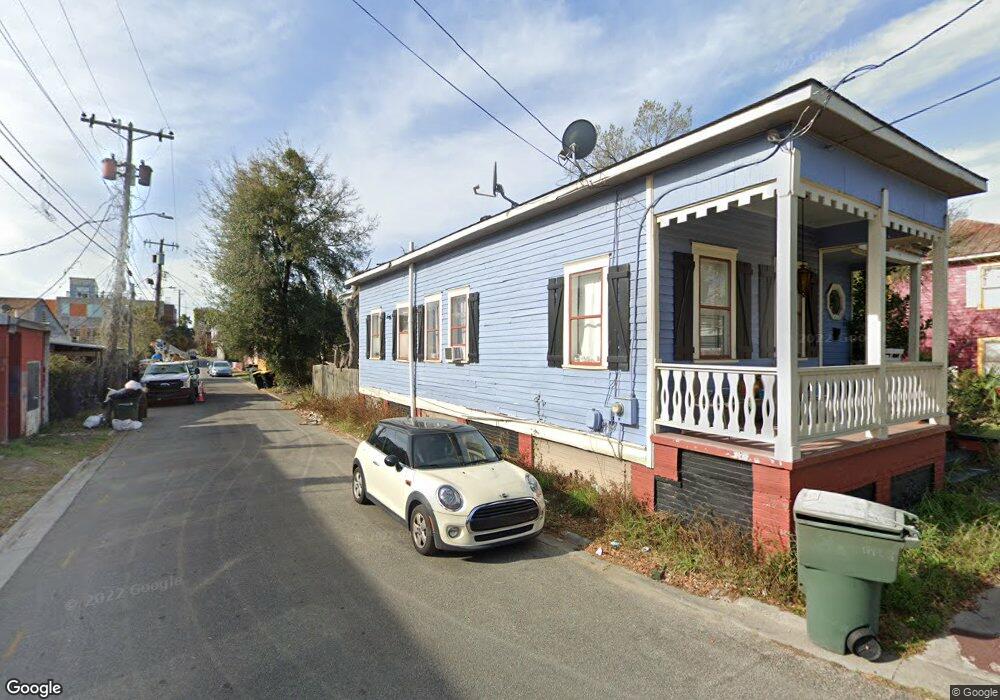
This home is located at 11 W 39th St, Savannah, GA 31401 and is currently estimated at $322,548, approximately $303 per square foot. 11 W 39th St is a home located in Chatham County with nearby schools including Derenne Middle School, Beach High School, and Susie King Taylor Community School.
Ownership History
Date
Name
Owned For
Owner Type
Purchase Details
Closed on
Jun 15, 2010
Sold by
Shernoff Elise Rubin
Bought by
Frontier Properties Savannah I
Current Estimated Value
Home Financials for this Owner
Home Financials are based on the most recent Mortgage that was taken out on this home.
Original Mortgage
$39,000
Outstanding Balance
$12,901
Interest Rate
4.83%
Mortgage Type
Commercial
Estimated Equity
$309,647
Create a Home Valuation Report for This Property
The Home Valuation Report is an in-depth analysis detailing your home's value as well as a comparison with similar homes in the area
Home Values in the Area
Average Home Value in this Area
Purchase History
| Date | Buyer | Sale Price | Title Company |
|---|---|---|---|
| Frontier Properties Savannah I | $43,000 | -- |
Source: Public Records
Mortgage History
| Date | Status | Borrower | Loan Amount |
|---|---|---|---|
| Open | Frontier Properties Savannah I | $39,000 |
Source: Public Records
Tax History Compared to Growth
Tax History
| Year | Tax Paid | Tax Assessment Tax Assessment Total Assessment is a certain percentage of the fair market value that is determined by local assessors to be the total taxable value of land and additions on the property. | Land | Improvement |
|---|---|---|---|---|
| 2025 | $2,736 | $92,240 | $50,000 | $42,240 |
| 2024 | $2,736 | $90,280 | $50,000 | $40,280 |
| 2023 | $1,049 | $85,960 | $50,000 | $35,960 |
| 2022 | $836 | $68,520 | $36,000 | $32,520 |
| 2021 | $2,133 | $36,160 | $5,000 | $31,160 |
| 2020 | $836 | $26,480 | $5,000 | $21,480 |
| 2019 | $1,175 | $26,480 | $5,000 | $21,480 |
| 2018 | $734 | $21,480 | $5,000 | $16,480 |
| 2017 | $665 | $22,680 | $5,480 | $17,200 |
| 2016 | $532 | $18,240 | $5,480 | $12,760 |
| 2015 | $988 | $17,480 | $5,480 | $12,000 |
| 2014 | $970 | $18,000 | $0 | $0 |
Source: Public Records
Map
Nearby Homes
- 2406 De Soto Ave Unit B
- 0 E Victory Dr Unit SA342445
- 111 E 39th St
- 221 W 39th St
- 102 E 38th St
- 2309 Jefferson St
- 303 W 39th St
- 17 E 37th St Unit 11
- 17 E 37th St Unit 3
- 17 E 37th St Unit 12
- 110 E 38th St
- 310 W 42nd St
- 302 W 38th St
- 306 W 38th St
- 312 W 38th St
- 420 W 42nd St
- 309 E 41st St
- 121 E Victory Dr
- 2114 Lincoln St
- 116 Pearl St
- 2308 Whitaker St
- 2302 Whitaker St
- 2301 Bull St
- 2240 Whitaker St
- 2310 Whitaker St
- 2307 Bull St
- 2312 Whitaker St
- 2217 Bull St
- 2234 Whitaker St
- 2230 Whitaker St
- 2301 Whitaker St
- 2305 Whitaker St
- 10 W 40th St
- 2307 Whitaker St Unit A
- 2307 Whitaker St Unit B
- 2226 Whitaker St
- 2226 Whitaker St Unit 2226-2228
- 2228 Whitaker St
- 2237 Whitaker St
- 2311 Whitaker St