11 W 6 Rd Giltner, NE 68841
Estimated Value: $126,000 - $228,000
2
Beds
1
Bath
1,054
Sq Ft
$159/Sq Ft
Est. Value
About This Home
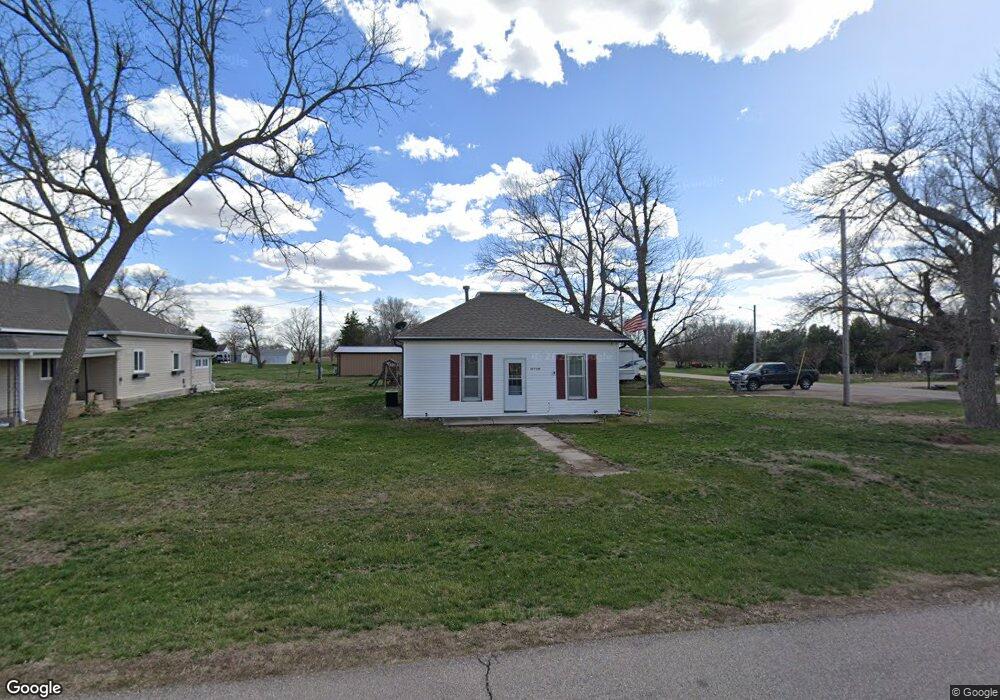
This home is located at 11 W 6 Rd, Giltner, NE 68841 and is currently estimated at $167,214, approximately $158 per square foot. 11 W 6 Rd is a home with nearby schools including Giltner High School.
Ownership History
Date
Name
Owned For
Owner Type
Purchase Details
Closed on
Nov 12, 2009
Sold by
Eastman Eileen V and Vern Eastman E
Bought by
Eastman Joan M
Current Estimated Value
Home Financials for this Owner
Home Financials are based on the most recent Mortgage that was taken out on this home.
Original Mortgage
$47,100
Outstanding Balance
$30,597
Interest Rate
4.9%
Mortgage Type
New Conventional
Estimated Equity
$136,617
Purchase Details
Closed on
Jul 11, 2007
Sold by
Omel Elton R and Omel Kay
Bought by
Eastman Eileen and Vern Eastman E
Home Financials for this Owner
Home Financials are based on the most recent Mortgage that was taken out on this home.
Original Mortgage
$48,000
Interest Rate
6.41%
Mortgage Type
Future Advance Clause Open End Mortgage
Create a Home Valuation Report for This Property
The Home Valuation Report is an in-depth analysis detailing your home's value as well as a comparison with similar homes in the area
Home Values in the Area
Average Home Value in this Area
Purchase History
| Date | Buyer | Sale Price | Title Company |
|---|---|---|---|
| Eastman Joan M | $45,000 | -- | |
| Eastman Eileen | $42,000 | -- |
Source: Public Records
Mortgage History
| Date | Status | Borrower | Loan Amount |
|---|---|---|---|
| Open | Eastman Joan M | $47,100 | |
| Closed | Eastman Eileen | $48,000 |
Source: Public Records
Tax History Compared to Growth
Tax History
| Year | Tax Paid | Tax Assessment Tax Assessment Total Assessment is a certain percentage of the fair market value that is determined by local assessors to be the total taxable value of land and additions on the property. | Land | Improvement |
|---|---|---|---|---|
| 2024 | $646 | $65,305 | $14,515 | $50,790 |
| 2023 | $974 | $65,305 | $14,515 | $50,790 |
| 2022 | $821 | $52,075 | $11,875 | $40,200 |
| 2021 | $834 | $52,075 | $11,875 | $40,200 |
| 2020 | $785 | $50,120 | $11,875 | $38,245 |
| 2019 | $793 | $50,120 | $11,875 | $38,245 |
| 2018 | $693 | $50,120 | $11,875 | $38,245 |
| 2017 | $719 | $50,120 | $11,875 | $38,245 |
| 2016 | $427 | $40,265 | $7,200 | $33,065 |
| 2010 | $441 | $41,720 | $0 | $0 |
Source: Public Records
Map
Nearby Homes