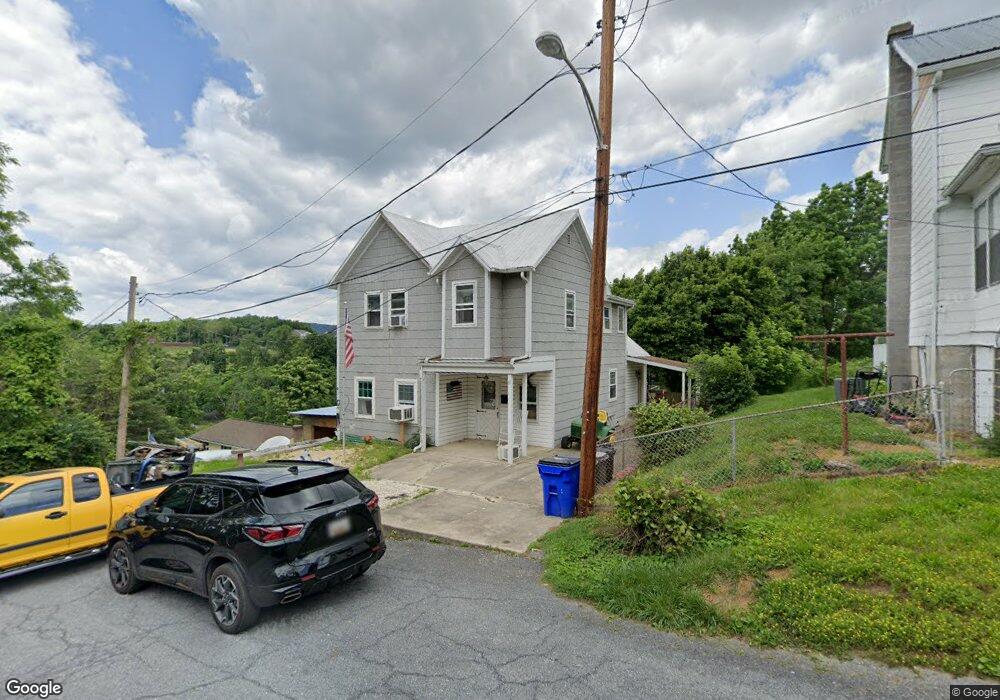
11 W F St Brunswick, MD 21716
Estimated Value: $311,799 - $343,000
--
Bed
2
Baths
1,466
Sq Ft
$220/Sq Ft
Est. Value
About This Home
This home is located at 11 W F St, Brunswick, MD 21716 and is currently estimated at $322,450, approximately $219 per square foot. 11 W F St is a home located in Frederick County with nearby schools including Brunswick Elementary School, Brunswick Middle School, and Brunswick High School.
Ownership History
Date
Name
Owned For
Owner Type
Purchase Details
Closed on
May 10, 1999
Sold by
Secretary Of Housing & Urban Dev
Bought by
Keeney Donald L and Keeney Connie R
Current Estimated Value
Purchase Details
Closed on
Jan 26, 1999
Sold by
Whalen John and Whalen Joyce A
Bought by
Secretary Of Housing & Urban Dev
Purchase Details
Closed on
May 3, 1993
Sold by
Longerbeam Roberta L
Bought by
Whalen John and Whalen Joyce A
Home Financials for this Owner
Home Financials are based on the most recent Mortgage that was taken out on this home.
Original Mortgage
$87,550
Interest Rate
7.43%
Create a Home Valuation Report for This Property
The Home Valuation Report is an in-depth analysis detailing your home's value as well as a comparison with similar homes in the area
Home Values in the Area
Average Home Value in this Area
Purchase History
| Date | Buyer | Sale Price | Title Company |
|---|---|---|---|
| Keeney Donald L | $78,300 | -- | |
| Secretary Of Housing & Urban Dev | $91,000 | -- | |
| Whalen John | $87,000 | -- |
Source: Public Records
Mortgage History
| Date | Status | Borrower | Loan Amount |
|---|---|---|---|
| Previous Owner | Whalen John | $87,550 | |
| Closed | Keeney Donald L | -- |
Source: Public Records
Tax History Compared to Growth
Tax History
| Year | Tax Paid | Tax Assessment Tax Assessment Total Assessment is a certain percentage of the fair market value that is determined by local assessors to be the total taxable value of land and additions on the property. | Land | Improvement |
|---|---|---|---|---|
| 2025 | $3,082 | $220,300 | -- | -- |
| 2024 | $3,082 | $205,700 | $86,100 | $119,600 |
| 2023 | $2,848 | $192,400 | $0 | $0 |
| 2022 | $2,712 | $179,100 | $0 | $0 |
| 2021 | $2,461 | $165,800 | $60,600 | $105,200 |
| 2020 | $2,461 | $156,333 | $0 | $0 |
| 2019 | $2,346 | $146,867 | $0 | $0 |
| 2018 | $2,275 | $137,400 | $43,500 | $93,900 |
| 2017 | $2,247 | $137,400 | $0 | $0 |
| 2016 | $2,375 | $135,467 | $0 | $0 |
| 2015 | $2,375 | $134,500 | $0 | $0 |
| 2014 | $2,375 | $134,500 | $0 | $0 |
Source: Public Records
Map
Nearby Homes
- 5 W D St
- 0 E D St Unit MDFR2057714
- 401 Karn Place
- TBB Shenandoah View Pkwy Unit ORCHID
- TBB Shenandoah View Pkwy Unit DAHLIA
- 13 E C St
- 123 N Virginia Ave
- 37 E C St
- 16 E C St
- 7 W B St
- 206 N Delaware Ave
- 52 Wenner Dr
- 228 Potomac View Pkwy
- 230 Potomac View Pkwy
- 21 E A St
- 15 N Maryland Ave
- 227 Potomac View Pkwy
- 101 E Potomac St
- 227 W Potomac St
- 230 W Potomac St