NOT LISTED FOR SALE

11 Wauwinet Ct Rehoboth Beach, DE 19971

Estimated Value: $282,915 - $722,000

4 Beds
3 Baths
3,000 Sq Ft
$187/Sq Ft Est. Value

Last Sold July 24, 2023

Last sale price $500,000 $167 Per Sq Ft

Est. 12% increase in value since last sale

Current estimated payment $3,280/month

Highlights

  • Contemporary Architecture
  • 1 Fireplace
  • 2 Car Attached Garage
  • Rehoboth Elementary School Rated A
  • Community Pool
  • Forced Air Heating and Cooling System

About This Home

As of July 2023

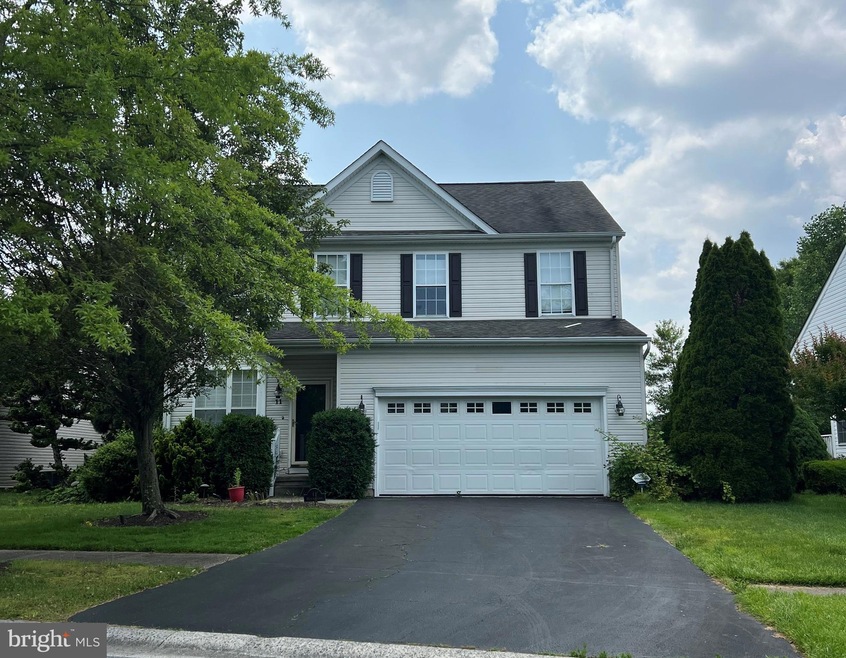
This home is located at 11 Wauwinet Ct, Rehoboth Beach, DE 19971 since 23 June 2023 and is currently estimated at $560,979, approximately $186 per square foot. This property was built in 2002. 11 Wauwinet Ct is a home located in Sussex County with nearby schools including Rehoboth Elementary School, Mariner Middle School, and Cape Henlopen High School.

Last Agent to Sell the Property

Andy Staton

Monument Sotheby's International Realty License #RS-0016036 Listed on: 06/23/2023

Monument Sotheby's International Realty

Last Buyer's Agent

Andy Staton

Monument Sotheby's International Realty License #RS-0016036 Listed on: 06/23/2023

Monument Sotheby's International Realty

Home Details

Home Type

  • Single Family

Est. Annual Taxes

  • $1,625

Year Built

  • Built in 2002

Lot Details

  • Lot Dimensions are 69.00 x 101.00
  • Property is zoned MR

HOA Fees

  • $83 Monthly HOA Fees

Parking

  • 2 Car Attached Garage
  • 2 Driveway Spaces
  • Front Facing Garage

Home Design

  • Contemporary Architecture
  • Frame Construction
  • Aluminum Siding

Interior Spaces

  • 3,000 Sq Ft Home
  • Property has 2 Levels
  • 1 Fireplace
  • Finished Basement

Bedrooms and Bathrooms

Utilities

  • Forced Air Heating and Cooling System
  • Metered Propane
  • Propane Water Heater

Listing and Financial Details

  • Tax Lot 32
  • Assessor Parcel Number 334-18.00-450.00

Community Details

Overview

  • Villages Of Old Landing Ii Subdivision

Recreation

  • Community Pool

Home Details

Home Type

Single Family

Est. Annual Taxes

$1,625

Year Built

Built in 2002

Lot Details

0

HOA Fees

$83 per month

Parking

2

Listing Details

  • Property Type: Residential
  • Structure Type: Detached
  • Architectural Style: Contemporary
  • Sussex De Quadrants: Between Rt 1 & 113
  • New Construction: No
  • Story List: Lower 1, Main, Upper 1
  • Federal Flood Zone: No
  • Year Built: 2002
  • Automatically Close On Close Date: No
  • Special Features: None
  • Property Sub Type: Detached
  • Stories: 0

Interior Features

  • Fireplaces Count: 1
  • Foundation Details: Other
  • Levels Count: 2
  • Basement: Yes
  • Basement Type: Fully Finished
  • Total Sq Ft: 3000
  • Living Area Sq Ft: 3000
  • Price Per Sq Ft: 166.67
  • Above Grade Finished Sq Ft: 3000
  • Above Grade Finished Area Units: Square Feet
  • Street Number Modifier: 11

Beds/Baths

  • Bedrooms: 4
  • Main Level Bedrooms: 1
  • All Lower Level Bedrooms: 1
  • Lower Level Bedroom: 1
  • Total Bathrooms: 3
  • Full Bathrooms: 3
  • Main Level Bathrooms: 1.00
  • Upper Level Bathrooms: 1
  • Lower Levels Bathrooms: 1
  • Upper Level Bathrooms: 1.00
  • Lower Levels Bathrooms: 1.00
  • Main Level Full Bathrooms: 1
  • Upper Level Full Bathrooms: 1
  • Lower Level Full Bathrooms: 1
  • Lower Level Full Bathrooms: 1

Exterior Features

  • Other Structures: Above Grade, Below Grade
  • Construction Materials: Frame, Aluminum Siding
  • Water Access: No
  • Waterfront: No
  • Water Oriented: No
  • Pool: Yes - Community
  • Tidal Water: No
  • Water View: No

Garage/Parking

  • Garage Spaces: 2.00
  • Garage: Yes
  • Garage Features: Garage - Front Entry
  • Attached Garage Spaces: 2
  • Total Garage And Parking Spaces: 4
  • Type Of Parking: Attached Garage, Driveway
  • Number of Spaces in Driveway: 2

Utilities

  • Central Air Conditioning: Yes
  • Cooling Fuel: Electric
  • Cooling Type: Central A/C
  • Heating Fuel: Propane - Metered
  • Heating Type: Forced Air
  • Heating: Yes
  • Hot Water: Propane
  • Sewer/Septic System: Public Sewer
  • Water Source: Public

Condo/Co-op/Association

  • HOA Fees: 250.00
  • HOA Fee Frequency: Quarterly
  • Condo Co-Op Association: No
  • HOA: Yes
  • Senior Community: No

Schools

  • School District: CAPE HENLOPEN
  • School District Key: 300200396895
  • School District Source: Listing Agent

Lot Info

  • Land Use Code: 999
  • Lot Dimensions: 69.00 x 101.00
  • Year Assessed: 2022
  • Zoning: MR
  • In City Limits: No

Rental Info

  • Vacation Rental: No

Tax Info

  • School Tax: 1473.00
  • Tax Annual Amount: 1625.00
  • Assessor Parcel Number: 334-18.00-450.00
  • Tax Lot: 32
  • County Tax Payment Frequency: Annually
  • Tax Year: 2022
  • Close Date: 07/24/2023

MLS Schools

  • School District Name: CAPE HENLOPEN

Ownership History

Date Name Owned For Owner Type

Purchase Details

Listed on
Jun 23, 2023
Closed on
Jul 24, 2023
Sold by
Johnson George F and Staton Andrew
Bought by
Vassi Joseph
Seller's Agent
Andy Staton
Monument Sotheby's International Realty
Buyer's Agent
Andy Staton
Monument Sotheby's International Realty
List Price
$500,000
Sold Price
$500,000
Current Estimated Value
$560,979

Home Financials for this Owner

Home Financials are based on the most recent Mortgage that was taken out on this home.
Estimated Appreciation
$60,979
Avg. Annual Appreciation
5.78%
Original Mortgage
$400,000
Outstanding Balance
$392,383
Interest Rate
6.5%
Mortgage Type
New Conventional
Estimated Equity
$169,566

Purchase Details

Closed on
Jun 25, 2002
Bought by
Johnson George F
Source: Public Records

Range of Values:

Collateral Analytics

Collateral Analytics Collateral Analytics AVMs (Automated Valuation Model) employ a number of statistical approaches combined with neighborhood-specific comparable selection guarantees the most up-to-date and precise valuations.

Not Available

Collateral Analytics does not have data for the current month. Please view the chart for historical values.

ICE

ICE Mortgage Technology ICE Mortgage Technology’s AVM (Automated Valuation Model) is a state-of-the-art online residential property valuation tool that provides a quick and accurate estimate of the value of almost any home in the U.S.

Not Available

ICE Mortgage Technology does not have data for the current month. Please view the chart for historical values.

First American

First American First American Data & Analytics’ next-generation AVM combines unrivaled data assets with a blended ensemble of valuation models to produce highly accurate, reliable valuations you can trust.

Not Available

First American does not have data for the current month. Please view the chart for historical values.

Quantarium

Quantarium Quantarium’s valuation service, repeatedly proven the industry’s most accurate and comprehensive, is supercharged with a self-learning and auto-tuning AI engine that continually becomes smarter and more accurate as it processes daily inputs from the industry’s leading RE data lake.

Not Available

Quantarium does not have data for the current month. Please view the chart for historical values.

Average Value
Not Available
List Price
Sold Price
Create a Home Valuation Report for This Property
The Home Valuation Report is an in-depth analysis detailing your home's value as well as a comparison with similar homes in the area

Home Values in the Area

Source: Public Records

Average Home Value in this Area


Source: Public Records

Purchase History

Date Buyer Sale Price Title Company
Vassi Joseph $500,000 None Listed On Document
Johnson George F $298,100 --
Source: Public Records

Mortgage History

Date Status Borrower Loan Amount
Open Vassi Joseph $400,000
Previous Owner Johnson George F $341,167
Previous Owner Johnson George F $343,686
Previous Owner Johnson George F $345,950
Previous Owner Johnson George F $269,250
Source: Public Records

Property History

Date Event Price Change Sq Ft Price
07/24/2023 07/24/23 Sold $500,000 0.0% $167 / Sq Ft
06/23/2023 06/23/23 For Sale $500,000 -- $167 / Sq Ft
Source: Bright MLS

Tax History Compared to Growth

Source: Public Records

Tax History

Year Tax Paid Tax Assessment Tax Assessment Total Assessment is a certain percentage of the fair market value that is determined by local assessors to be the total taxable value of land and additions on the property. Land Improvement
2024 $1,686 $34,200 $5,300 $28,900
2023 $1,184 $34,200 $5,300 $28,900
2022 $1,125 $34,200 $5,300 $28,900
2021 $1,211 $34,200 $5,300 $28,900
2020 $1,206 $34,200 $5,300 $28,900
2019 $1,208 $34,200 $5,300 $28,900
2018 $1,102 $34,200 $0 $0
2017 $1,038 $34,200 $0 $0
2016 $866 $34,200 $0 $0
2015 $805 $34,200 $0 $0
2014 $796 $34,200 $0 $0
Source: Public Records

Agents Affiliated with this Home

  • Section Image
See All Agents

Map

Source: Bright MLS

MLS Number: DESU2043062

Bright MLS

APN: 334-18.00-450.00