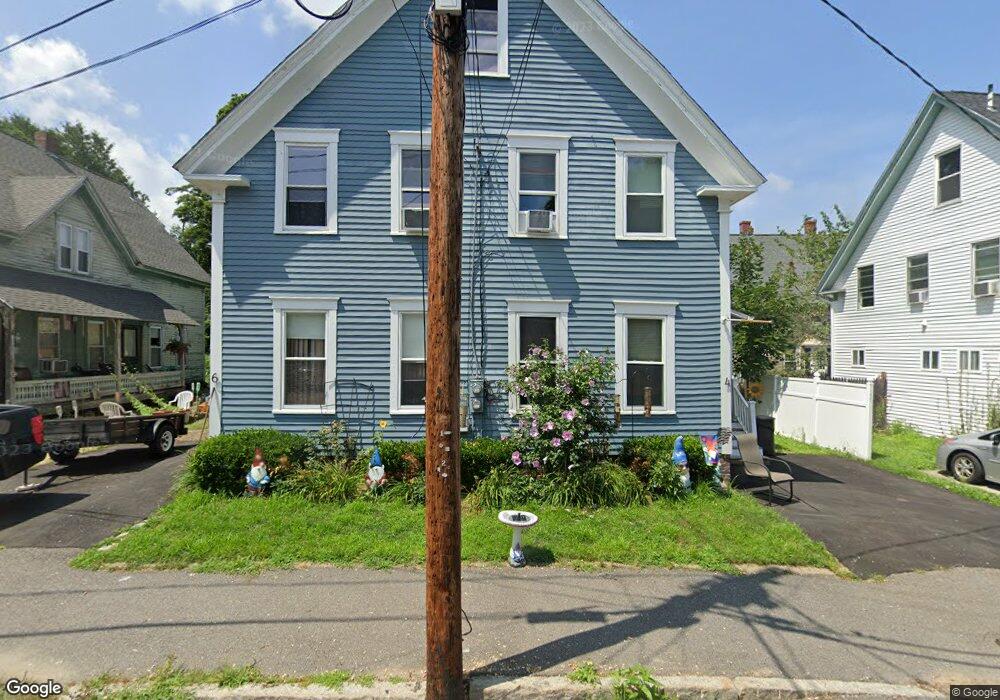
11 Waverly St Unit 13 Concord, NH 03301
North End NeighborhoodEstimated Value: $358,142 - $587,000
6
Beds
2
Baths
2,285
Sq Ft
$200/Sq Ft
Est. Value
About This Home
This home is located at 11 Waverly St Unit 13, Concord, NH 03301 and is currently estimated at $456,536, approximately $199 per square foot. 11 Waverly St Unit 13 is a home located in Merrimack County with nearby schools including Christa McAuliffe School, Rundlett Middle School, and Concord High School.
Ownership History
Date
Name
Owned For
Owner Type
Purchase Details
Closed on
Jan 3, 2024
Sold by
Smith Michael J and Smith Sarah E
Bought by
Garland Corey and Kraft-Lund Arianne
Current Estimated Value
Home Financials for this Owner
Home Financials are based on the most recent Mortgage that was taken out on this home.
Original Mortgage
$432,030
Outstanding Balance
$424,943
Interest Rate
7.29%
Mortgage Type
FHA
Estimated Equity
$31,593
Purchase Details
Closed on
Aug 15, 2008
Sold by
Pike Ft and Pike
Bought by
Smith Michael J and Arata Sara E
Home Financials for this Owner
Home Financials are based on the most recent Mortgage that was taken out on this home.
Original Mortgage
$234,406
Interest Rate
6.4%
Mortgage Type
Purchase Money Mortgage
Create a Home Valuation Report for This Property
The Home Valuation Report is an in-depth analysis detailing your home's value as well as a comparison with similar homes in the area
Home Values in the Area
Average Home Value in this Area
Purchase History
| Date | Buyer | Sale Price | Title Company |
|---|---|---|---|
| Garland Corey | $440,000 | None Available | |
| Smith Michael J | $237,500 | -- |
Source: Public Records
Mortgage History
| Date | Status | Borrower | Loan Amount |
|---|---|---|---|
| Open | Garland Corey | $432,030 | |
| Previous Owner | Smith Michael J | $230,353 | |
| Previous Owner | Smith Michael J | $237,922 | |
| Previous Owner | Smith Michael J | $234,406 |
Source: Public Records
Tax History Compared to Growth
Tax History
| Year | Tax Paid | Tax Assessment Tax Assessment Total Assessment is a certain percentage of the fair market value that is determined by local assessors to be the total taxable value of land and additions on the property. | Land | Improvement |
|---|---|---|---|---|
| 2024 | $6,881 | $248,500 | $89,700 | $158,800 |
| 2023 | $6,892 | $256,600 | $89,700 | $166,900 |
| 2022 | $6,643 | $256,600 | $89,700 | $166,900 |
| 2021 | $6,446 | $256,600 | $89,700 | $166,900 |
| 2020 | $5,756 | $215,100 | $71,800 | $143,300 |
| 2019 | $5,398 | $194,300 | $66,000 | $128,300 |
| 2018 | $5,686 | $201,700 | $64,700 | $137,000 |
| 2017 | $5,566 | $197,100 | $62,700 | $134,400 |
| 2016 | $5,039 | $182,100 | $62,700 | $119,400 |
| 2015 | $4,588 | $167,800 | $58,100 | $109,700 |
| 2014 | $4,499 | $167,800 | $58,100 | $109,700 |
| 2013 | $4,060 | $158,700 | $58,100 | $100,600 |
| 2012 | $4,248 | $174,300 | $58,100 | $116,200 |
Source: Public Records
Map
Nearby Homes
- 8-10 Granite Ave
- 20 Prospect St
- 157 Rumford St
- 30 Jackson St
- 11 Washington St
- 282-284 N State St
- 3 Palm St
- 19 Grappone Dr
- 4 Fayette St
- 26 South St
- 11 Eastman St
- 1 Kensington Rd
- 2 Kensington Rd
- 35 Callaway Dr Unit 2
- 47 South St
- 10 Perley St
- 24 Pierce St
- 6 Heights Rd
- 61 Mountain Rd
- 0 Spruce St Unit 88
- 11-13 Waverly St
- 15 Waverly St
- 79 Waverly St
- 12 Waverly St
- 35 Waverly St
- 8 Waverly St Unit 10
- 200 Rumford St
- 4 Waverly St Unit 4
- 175 N State St Unit 177
- 202 Rumford St
- 196 Rumford St
- 179- 181 N State
- 179-181 N State St
- 181 N State St
- 179 N State St Unit 181
- 204 Rumford St
- 183-185 N State St
- 185 N State St
- 183 N State St Unit 185
- 194 Rumford St