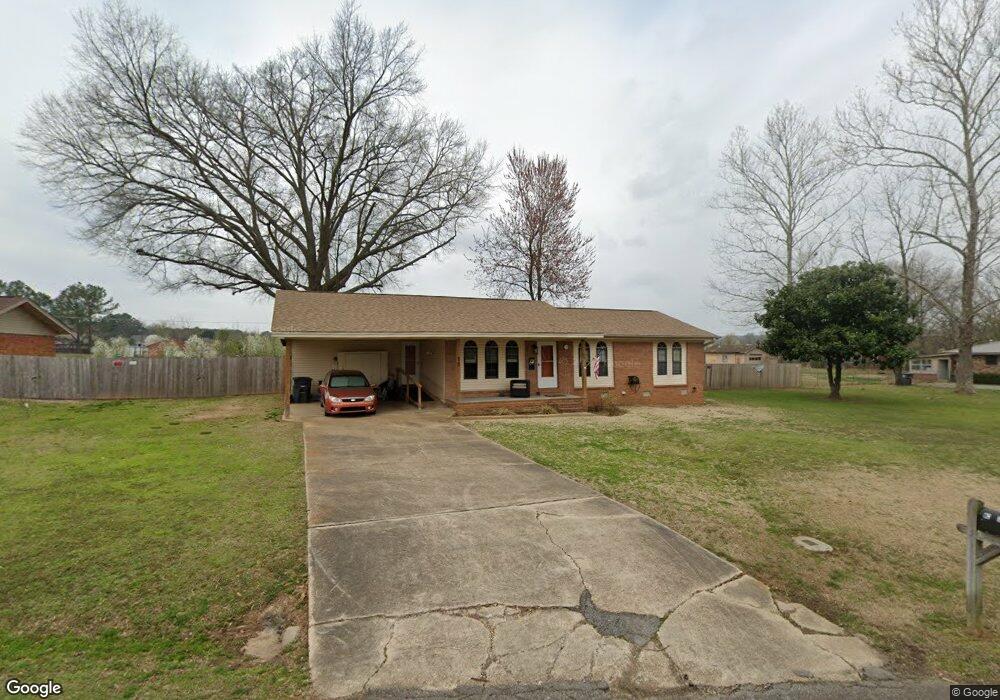
11 Westgate St Searcy, AR 72143
Estimated Value: $175,711 - $183,000
Studio
2
Baths
1,480
Sq Ft
$122/Sq Ft
Est. Value
About This Home
This home is located at 11 Westgate St, Searcy, AR 72143 and is currently estimated at $180,428, approximately $121 per square foot. 11 Westgate St is a home located in White County with nearby schools including Westside Elementary School, Southwest Middle School, and Ahlf Junior High School.
Ownership History
Date
Name
Owned For
Owner Type
Purchase Details
Closed on
Sep 30, 2020
Sold by
House Tony M
Bought by
House Bruce
Current Estimated Value
Purchase Details
Closed on
May 1, 2020
Sold by
Baker Douglas A and Baker Mary K
Bought by
House Tony M and House Bruce
Purchase Details
Closed on
May 4, 2005
Sold by
Carter Robert A and Carter Almeita K
Bought by
Baker Douglas A and Baker Mary K
Home Financials for this Owner
Home Financials are based on the most recent Mortgage that was taken out on this home.
Original Mortgage
$94,000
Interest Rate
6.06%
Mortgage Type
Future Advance Clause Open End Mortgage
Purchase Details
Closed on
Sep 1, 1994
Bought by
Carter Robert A and Carter Almeita K
Purchase Details
Closed on
Feb 1, 1991
Bought by
Gullett Davis M and Gullett Phyliss T
Purchase Details
Closed on
Aug 1, 1985
Bought by
Hall Richard D
Create a Home Valuation Report for This Property
The Home Valuation Report is an in-depth analysis detailing your home's value as well as a comparison with similar homes in the area
Purchase History
| Date | Buyer | Sale Price | Title Company |
|---|---|---|---|
| House Bruce | -- | Wilbourn Title And Closing | |
| House Tony M | $120,000 | None Available | |
| Baker Douglas A | $94,000 | None Available | |
| Carter Robert A | $60,000 | -- | |
| Gullett Davis M | $56,000 | -- | |
| Hall Richard D | $57,000 | -- |
Source: Public Records
Mortgage History
| Date | Status | Borrower | Loan Amount |
|---|---|---|---|
| Previous Owner | Baker Douglas A | $94,000 |
Source: Public Records
Tax History
| Year | Tax Paid | Tax Assessment Tax Assessment Total Assessment is a certain percentage of the fair market value that is determined by local assessors to be the total taxable value of land and additions on the property. | Land | Improvement |
|---|---|---|---|---|
| 2025 | $1,046 | $25,760 | $6,340 | $19,420 |
| 2024 | $1,046 | $25,760 | $6,340 | $19,420 |
| 2023 | $1,046 | $25,760 | $6,340 | $19,420 |
| 2022 | $1,046 | $25,760 | $6,340 | $19,420 |
| 2021 | $1,046 | $25,760 | $6,340 | $19,420 |
| 2020 | $1,043 | $25,700 | $10,780 | $14,920 |
| 2019 | $668 | $25,700 | $10,780 | $14,920 |
| 2018 | $666 | $25,700 | $10,780 | $14,920 |
| 2017 | $927 | $25,700 | $10,780 | $14,920 |
| 2016 | $927 | $22,840 | $10,780 | $12,060 |
| 2015 | $848 | $20,880 | $7,380 | $13,500 |
| 2014 | $812 | $20,010 | $7,380 | $12,630 |
Source: Public Records
Map
Nearby Homes
- 134 Mary Irene Ln
- 144 Mary Irene Ln
- 215 Joy Dr
- 7 Palmer Ct
- 00-Lot C W Beebe Capps Expy
- 00-Lot A W Beebe Capps Expy
- 00-Lot B W Beebe Capps Expy
- 50 Sherwood Loop
- 505 Chesapeake Dr
- 431 Natalie Cir
- 803 Adamson Dr
- 102 N Sawmill Rd
- 404 S Sawmill Rd
- 19 Hartwell Place
- 2208 Jonathan Ln
- 42 Stoneybrook Ln
- 311 N Sawmill Rd
- 2406 Brittany Ln
- 807 Valley Dr
- 105 Longleaf Dr
- 9 Westgate St
- 15 Westgate St
- 7 Westgate St
- 12 Westgate St
- 17 Westgate St
- 10 Westgate St
- 0 Westgate Unit 15025943
- 0 Westgate Unit 20033594
- 0 Westgate Unit 20033439
- 0 Westgate Unit 20028515
- 0 Westgate Unit 17005955
- 14 Westgate St
- 8 Westgate St
- 16 Westgate St
- 5 Westgate St
- 19 Westgate St
- 6 Westgate St
- 2612 Chapel Ln
- 20 Westgate St
- 3 Westgate St
Your Personal Tour Guide
Ask me questions while you tour the home.