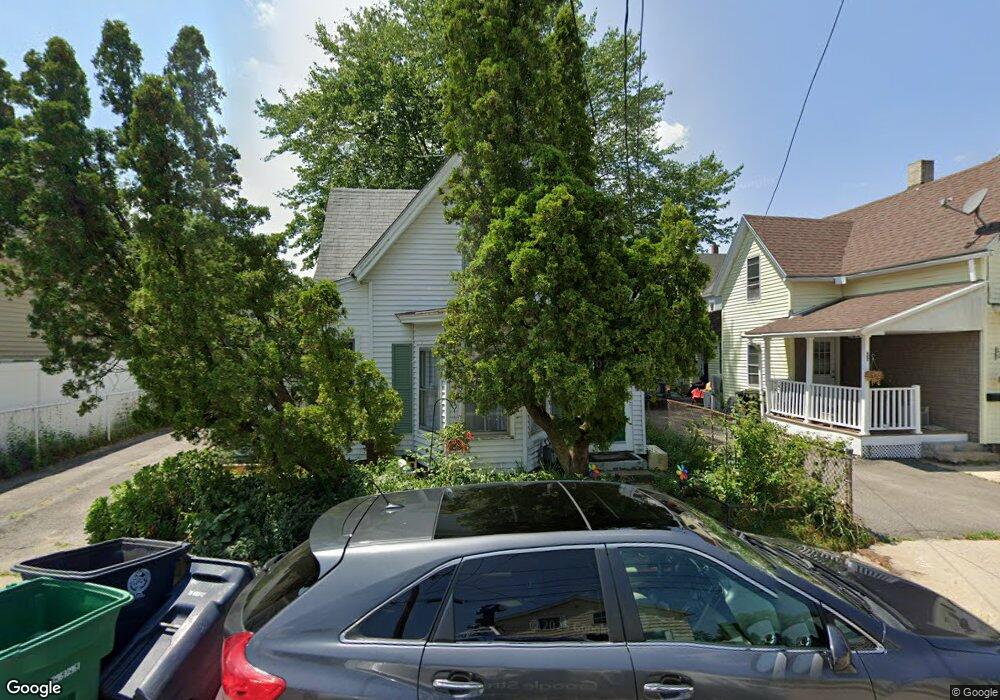
11 Wilder St Nashua, NH 03060
South End Nashua NeighborhoodEstimated Value: $385,000 - $426,260
3
Beds
2
Baths
1,305
Sq Ft
$313/Sq Ft
Est. Value
About This Home
This home is located at 11 Wilder St, Nashua, NH 03060 and is currently estimated at $409,065, approximately $313 per square foot. 11 Wilder St is a home located in Hillsborough County with nearby schools including Ledge Street Elementary School, Fairgrounds Middle School, and Nashua High School South.
Ownership History
Date
Name
Owned For
Owner Type
Purchase Details
Closed on
Apr 30, 2020
Sold by
Cogan Ft and Cogan
Bought by
Cogan James R and Cogan Carolyn K
Current Estimated Value
Home Financials for this Owner
Home Financials are based on the most recent Mortgage that was taken out on this home.
Original Mortgage
$158,730
Interest Rate
3%
Mortgage Type
FHA
Purchase Details
Closed on
Apr 16, 2020
Sold by
Cogan James R and Cogan Carolyn K
Bought by
Cogan Ft and Cogan
Home Financials for this Owner
Home Financials are based on the most recent Mortgage that was taken out on this home.
Original Mortgage
$158,730
Interest Rate
3%
Mortgage Type
FHA
Purchase Details
Closed on
Oct 5, 2015
Sold by
Cogan James R and Cogan Carolyn K
Bought by
Cogan Ft and Cogan
Purchase Details
Closed on
May 11, 1973
Bought by
Cogan Ft
Create a Home Valuation Report for This Property
The Home Valuation Report is an in-depth analysis detailing your home's value as well as a comparison with similar homes in the area
Home Values in the Area
Average Home Value in this Area
Purchase History
| Date | Buyer | Sale Price | Title Company |
|---|---|---|---|
| Cogan James R | -- | None Available | |
| Cogan Ft | -- | None Available | |
| Cogan Ft | -- | -- | |
| Cogan Ft | -- | -- |
Source: Public Records
Mortgage History
| Date | Status | Borrower | Loan Amount |
|---|---|---|---|
| Previous Owner | Cogan Ft | $158,730 | |
| Previous Owner | Cogan Ft | $153,450 | |
| Previous Owner | Cogan Ft | $30,530 | |
| Previous Owner | Cogan Ft | $164,000 | |
| Previous Owner | Cogan Ft | $156,000 |
Source: Public Records
Tax History Compared to Growth
Tax History
| Year | Tax Paid | Tax Assessment Tax Assessment Total Assessment is a certain percentage of the fair market value that is determined by local assessors to be the total taxable value of land and additions on the property. | Land | Improvement |
|---|---|---|---|---|
| 2024 | $5,780 | $363,500 | $109,000 | $254,500 |
| 2023 | $5,622 | $308,400 | $87,200 | $221,200 |
| 2022 | $5,573 | $308,400 | $87,200 | $221,200 |
| 2021 | $4,616 | $198,800 | $58,100 | $140,700 |
| 2020 | $4,495 | $198,800 | $58,100 | $140,700 |
| 2019 | $4,326 | $198,800 | $58,100 | $140,700 |
| 2018 | $4,217 | $198,800 | $58,100 | $140,700 |
| 2017 | $4,008 | $155,400 | $56,400 | $99,000 |
| 2016 | $3,896 | $155,400 | $56,400 | $99,000 |
| 2015 | $3,812 | $155,400 | $56,400 | $99,000 |
| 2014 | $3,737 | $155,400 | $56,400 | $99,000 |
Source: Public Records
Map
Nearby Homes
- 4 Badger St
- 29 Wilder St
- 30 Ledge St
- 71 Vine St Unit 713/4
- 8 Buck St Unit 10
- 38 Central St
- 121 Palm St
- 169A W Hollis St Unit 193
- 19.5 Balcom St
- 32-34 Grand Ave
- 16-18 Perry Ave
- 6 Lake Ave
- 15 Lovell St Unit 20
- 15 Lovell St Unit 3
- 15 Lovell St Unit 10
- 70 Linwood St
- 30 Dexter St Unit 106
- 24 E Otterson St
- 13 Wason Ave Unit 29
- 22 New Dunstable Rd Unit 132133