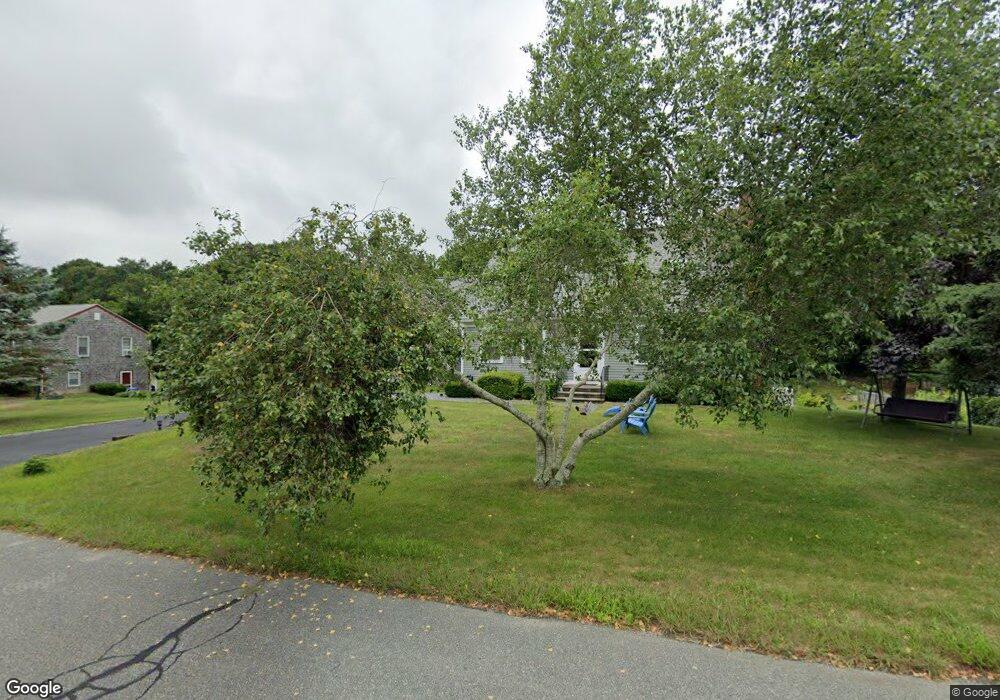
11 Windsong Cir Pocasset, MA 02559
Pocasset NeighborhoodEstimated Value: $770,273 - $861,000
3
Beds
2
Baths
2,016
Sq Ft
$402/Sq Ft
Est. Value
About This Home
This home is located at 11 Windsong Cir, Pocasset, MA 02559 and is currently estimated at $810,068, approximately $401 per square foot. 11 Windsong Cir is a home located in Barnstable County with nearby schools including Bourne High School and Cadence Academy Preschool - Bourne.
Ownership History
Date
Name
Owned For
Owner Type
Purchase Details
Closed on
Jun 29, 2015
Sold by
Lyons Kevin E and Lyons Kathleen M
Bought by
Kevin E & K M Lyons Ret and Lyons
Current Estimated Value
Create a Home Valuation Report for This Property
The Home Valuation Report is an in-depth analysis detailing your home's value as well as a comparison with similar homes in the area
Home Values in the Area
Average Home Value in this Area
Purchase History
| Date | Buyer | Sale Price | Title Company |
|---|---|---|---|
| Kevin E & K M Lyons Ret | -- | -- |
Source: Public Records
Tax History Compared to Growth
Tax History
| Year | Tax Paid | Tax Assessment Tax Assessment Total Assessment is a certain percentage of the fair market value that is determined by local assessors to be the total taxable value of land and additions on the property. | Land | Improvement |
|---|---|---|---|---|
| 2025 | $5,038 | $645,100 | $233,300 | $411,800 |
| 2024 | $4,927 | $614,300 | $222,200 | $392,100 |
| 2023 | $4,518 | $512,800 | $188,100 | $324,700 |
| 2022 | $4,662 | $462,000 | $204,300 | $257,700 |
| 2021 | $4,529 | $420,500 | $185,900 | $234,600 |
| 2020 | $4,317 | $402,000 | $184,100 | $217,900 |
| 2019 | $4,096 | $389,700 | $184,100 | $205,600 |
| 2018 | $3,912 | $371,200 | $175,400 | $195,800 |
| 2017 | $3,679 | $357,200 | $160,900 | $196,300 |
| 2016 | $3,559 | $350,300 | $160,900 | $189,400 |
| 2015 | -- | $376,000 | $186,600 | $189,400 |
Source: Public Records
Map
Nearby Homes
- 171 Bellavista Dr
- 254 Barlows Landing Rd
- 34 Kenwood Rd
- 45 Kenwood Rd
- 70 Wings Neck Rd
- 940 County Rd
- 709 County Rd
- 14 Navajo Rd
- 174 Barlows Landing Rd
- 24 Richmond Rd
- 15 1st St
- 7 4th Ave
- 22 Nairn Rd
- 39 Bennets Neck Dr
- 940 County Rd
- 48 Red Brook Harbor Rd
- 3 Red Brook Pond Dr
- 1094 County Rd
- 89 Harbor Dr
- 7 Portside Dr