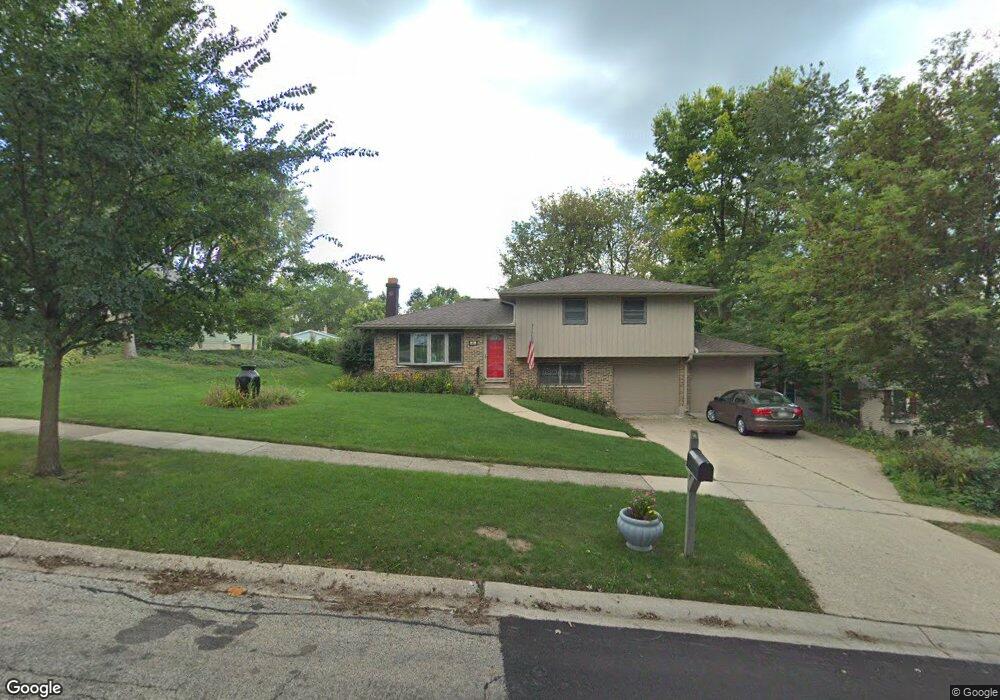
11 Woodview Ln Algonquin, IL 60102
Algonquin Heights NeighborhoodEstimated Value: $331,885 - $363,000
3
Beds
2
Baths
1,192
Sq Ft
$295/Sq Ft
Est. Value
About This Home
This home is located at 11 Woodview Ln, Algonquin, IL 60102 and is currently estimated at $352,221, approximately $295 per square foot. 11 Woodview Ln is a home located in McHenry County with nearby schools including Eastview Elementary School, Algonquin Middle School, and Dundee-Crown High School.
Ownership History
Date
Name
Owned For
Owner Type
Purchase Details
Closed on
Jul 5, 2017
Sold by
Kalemba Mark S and Bonk Kathleen A
Bought by
Gezing Mark
Current Estimated Value
Home Financials for this Owner
Home Financials are based on the most recent Mortgage that was taken out on this home.
Original Mortgage
$219,844
Outstanding Balance
$182,553
Interest Rate
3.87%
Mortgage Type
FHA
Estimated Equity
$169,668
Purchase Details
Closed on
Oct 26, 2007
Sold by
Hadler Lynn D and Hadler Kathy J
Bought by
Kalemba Mark S and Bonk Kathleen A
Purchase Details
Closed on
Dec 19, 1998
Sold by
Hadler Lynn D and Hadler Kathy J
Bought by
Hadler Lynn D and Hadler Kathy J
Home Financials for this Owner
Home Financials are based on the most recent Mortgage that was taken out on this home.
Original Mortgage
$50,000
Interest Rate
6.95%
Create a Home Valuation Report for This Property
The Home Valuation Report is an in-depth analysis detailing your home's value as well as a comparison with similar homes in the area
Home Values in the Area
Average Home Value in this Area
Purchase History
| Date | Buyer | Sale Price | Title Company |
|---|---|---|---|
| Gezing Mark | $223,900 | First American Title | |
| Kalemba Mark S | $232,000 | Heritage Title Company | |
| Hadler Lynn D | -- | Land Title Group Inc |
Source: Public Records
Mortgage History
| Date | Status | Borrower | Loan Amount |
|---|---|---|---|
| Open | Gezing Mark | $219,844 | |
| Previous Owner | Hadler Lynn D | $50,000 |
Source: Public Records
Tax History Compared to Growth
Tax History
| Year | Tax Paid | Tax Assessment Tax Assessment Total Assessment is a certain percentage of the fair market value that is determined by local assessors to be the total taxable value of land and additions on the property. | Land | Improvement |
|---|---|---|---|---|
| 2024 | $6,498 | $91,065 | $13,915 | $77,150 |
| 2023 | $6,148 | $81,446 | $12,445 | $69,001 |
| 2022 | $5,165 | $66,223 | $17,250 | $48,973 |
| 2021 | $4,942 | $61,694 | $16,070 | $45,624 |
| 2020 | $4,805 | $59,510 | $15,501 | $44,009 |
| 2019 | $4,679 | $56,958 | $14,836 | $42,122 |
| 2018 | $5,015 | $52,617 | $13,705 | $38,912 |
| 2017 | $4,339 | $49,569 | $12,911 | $36,658 |
| 2016 | $4,258 | $46,491 | $12,109 | $34,382 |
| 2013 | -- | $52,690 | $11,296 | $41,394 |
Source: Public Records
Map
Nearby Homes
- 2 Sunset Ln
- 1188 E Algonquin Rd
- 911 Old Oak Cir Unit 1
- 920 Plymouth Ct
- 903 Old Oak Cir
- 1011 Wesley Ln
- 600 E Algonquin Rd
- 1659 E Algonquin Rd
- 1561 Cumberland Pkwy
- 620 Old Oak Cir
- Lot 4 b Ryan Pkwy
- 1770 E Algonquin Rd
- 925 N River Rd
- 0 River Dr N Unit MRD12473279
- 9999 Sandbloom Rd
- 605 Claymont Ct
- 1114 Riverwood Dr Unit 1114
- 420 N Harrison St
- 1782 Cumberland Pkwy
- 400 Diamond Back Way