Estimated Value: $147,000 - $196,000
3
Beds
3
Baths
1,500
Sq Ft
$113/Sq Ft
Est. Value
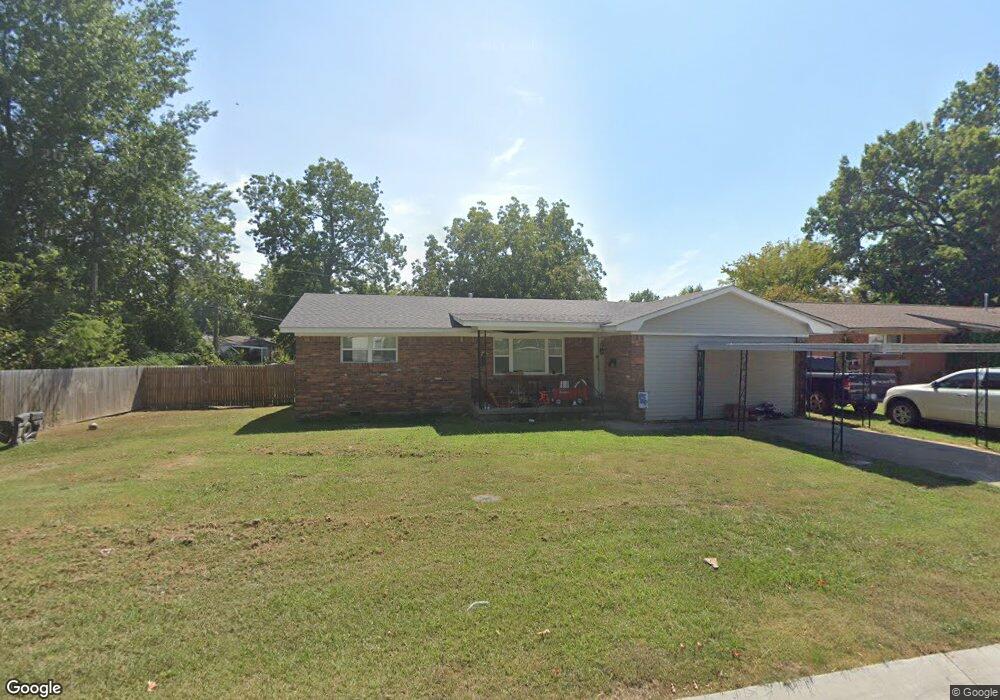
About This Home
This home is located at 110 12th Ave NE, Miami, OK 74354 and is currently estimated at $169,296, approximately $112 per square foot. 110 12th Ave NE is a home located in Ottawa County with nearby schools including Miami High School and Mt. Olive Lutheran School.
Ownership History
Date
Name
Owned For
Owner Type
Purchase Details
Closed on
Jun 25, 2020
Sold by
Brodrick Deborah
Bought by
Davis Properties Llc
Current Estimated Value
Home Financials for this Owner
Home Financials are based on the most recent Mortgage that was taken out on this home.
Original Mortgage
$70,000
Outstanding Balance
$62,050
Interest Rate
3.2%
Mortgage Type
Future Advance Clause Open End Mortgage
Estimated Equity
$107,246
Create a Home Valuation Report for This Property
The Home Valuation Report is an in-depth analysis detailing your home's value as well as a comparison with similar homes in the area
Purchase History
| Date | Buyer | Sale Price | Title Company |
|---|---|---|---|
| Davis Properties Llc | $20,000 | Ottawa Cnty Abstract & Ttl C |
Source: Public Records
Mortgage History
| Date | Status | Borrower | Loan Amount |
|---|---|---|---|
| Open | Davis Properties Llc | $70,000 |
Source: Public Records
Tax History
| Year | Tax Paid | Tax Assessment Tax Assessment Total Assessment is a certain percentage of the fair market value that is determined by local assessors to be the total taxable value of land and additions on the property. | Land | Improvement |
|---|---|---|---|---|
| 2025 | $1,285 | $14,339 | $687 | $13,652 |
| 2024 | $1,319 | $14,678 | $687 | $13,991 |
| 2023 | $1,319 | $14,250 | $798 | $13,452 |
| 2022 | $1,225 | $14,250 | $798 | $13,452 |
| 2021 | $593 | $2,280 | $148 | $2,132 |
| 2020 | $569 | $5,972 | $540 | $5,432 |
| 2019 | $467 | $5,688 | $520 | $5,168 |
| 2018 | $282 | $5,417 | $500 | $4,917 |
| 2017 | $274 | $5,260 | $489 | $4,771 |
| 2016 | $250 | $5,107 | $478 | $4,629 |
| 2015 | $377 | $4,239 | $854 | $3,385 |
| 2014 | $242 | $4,958 | $464 | $4,494 |
Source: Public Records
Map
Nearby Homes
Your Personal Tour Guide
Ask me questions while you tour the home.