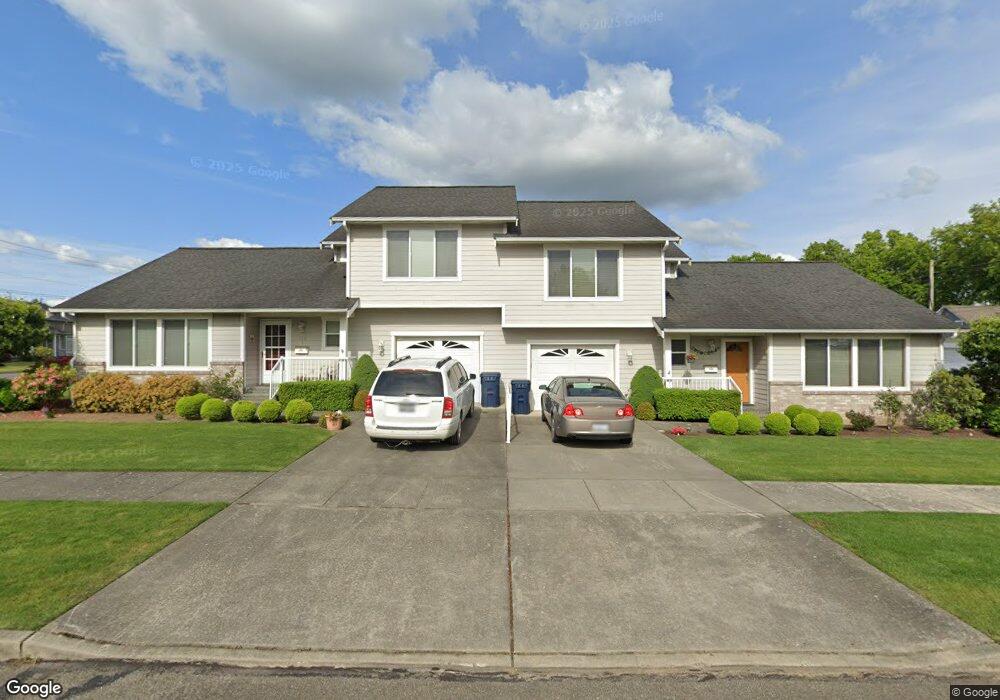
110 12th St Unit A Lynden, WA 98264
Estimated Value: $415,000 - $473,000
2
Beds
3
Baths
1,456
Sq Ft
$304/Sq Ft
Est. Value
About This Home
This home is located at 110 12th St Unit A, Lynden, WA 98264 and is currently estimated at $442,555, approximately $303 per square foot. 110 12th St Unit A is a home located in Whatcom County with nearby schools including Lynden High School, Lynden Christian School, and Lynden Christian Schools: Administration.
Ownership History
Date
Name
Owned For
Owner Type
Purchase Details
Closed on
Jun 7, 2015
Sold by
Nyssen Mae
Bought by
Ruiter Janis
Current Estimated Value
Home Financials for this Owner
Home Financials are based on the most recent Mortgage that was taken out on this home.
Original Mortgage
$32,000
Outstanding Balance
$24,803
Interest Rate
3.77%
Mortgage Type
New Conventional
Estimated Equity
$417,752
Purchase Details
Closed on
Aug 9, 2011
Sold by
Wayland Marilyn I and Wayland William C
Bought by
Nyssen Mae
Purchase Details
Closed on
Apr 15, 2004
Sold by
West Stephanie
Bought by
Christenson Marily
Purchase Details
Closed on
Oct 23, 2003
Sold by
Blankers Peter
Bought by
West Stephanie
Home Financials for this Owner
Home Financials are based on the most recent Mortgage that was taken out on this home.
Original Mortgage
$161,910
Interest Rate
6.14%
Mortgage Type
Seller Take Back
Create a Home Valuation Report for This Property
The Home Valuation Report is an in-depth analysis detailing your home's value as well as a comparison with similar homes in the area
Home Values in the Area
Average Home Value in this Area
Purchase History
| Date | Buyer | Sale Price | Title Company |
|---|---|---|---|
| Ruiter Janis | $175,000 | Chicago Title Insurance | |
| Nyssen Mae | $205,280 | Chicago Title Insurance | |
| Christenson Marily | $181,000 | Chicago Title Insurance | |
| West Stephanie | -- | Chicago Title Insurance |
Source: Public Records
Mortgage History
| Date | Status | Borrower | Loan Amount |
|---|---|---|---|
| Open | Ruiter Janis | $32,000 | |
| Previous Owner | West Stephanie | $161,910 |
Source: Public Records
Tax History Compared to Growth
Tax History
| Year | Tax Paid | Tax Assessment Tax Assessment Total Assessment is a certain percentage of the fair market value that is determined by local assessors to be the total taxable value of land and additions on the property. | Land | Improvement |
|---|---|---|---|---|
| 2024 | $276 | $365,760 | $60,000 | $305,760 |
| 2023 | $276 | $365,760 | $60,000 | $305,760 |
| 2022 | $359 | $320,494 | $77,958 | $138,706 |
| 2021 | $394 | $283,624 | $68,990 | $138,706 |
| 2020 | $410 | $257,835 | $62,717 | $195,118 |
| 2019 | $430 | $244,385 | $59,445 | $184,940 |
| 2018 | $459 | $222,185 | $54,045 | $168,140 |
| 2017 | $1,942 | $191,290 | $46,530 | $144,760 |
| 2016 | $1,887 | $179,518 | $40,812 | $138,706 |
| 2015 | $444 | $173,401 | $39,216 | $134,185 |
| 2014 | -- | $161,061 | $36,442 | $124,619 |
| 2013 | -- | $159,278 | $36,100 | $123,178 |
Source: Public Records
Map
Nearby Homes
- 1218 Front St
- 0 Guide Meridian Unit NWM2369980
- 915 Front St
- 908 Liberty St
- 410 10th St
- 706 Judson St Unit B
- 706 Judson St Unit A
- 1510 E St
- 2016 Steelhead Way
- 314 S 16th St
- 518 Edson St
- 403 17th St
- 1717 E St
- 1584 Main St
- 210 Stremler Dr
- 104 Riverwalk Dr
- 206 Pebblebrook Dr
- 102 Riverwalk Dr
- 204 Pebblebrook Dr
- 515 17th St
- 110 12th St Unit B
- 1111 Grover St
- 1111 Grover St Unit 2C
- 1111 Grover St Unit 2B
- 1111 Grover St Unit 2A
- 1111 Grover St Unit 1C
- 1111 Grover St Unit 1B
- 1111 Grover St Unit 1A
- 1118 Front St
- 1112 Front St
- 1201 Grover St
- 1108 Front St
- 109 12th St
- 1101 Grover St
- 109 11th St
- 1200 Front St
- 1101 Grover St
- 1106 Front St
- 1205 Grover St
- 1118 Grover St