110 1st St Hamden, CT 06514
Estimated Value: $315,000 - $459,000
6
Beds
2
Baths
2,614
Sq Ft
$151/Sq Ft
Est. Value
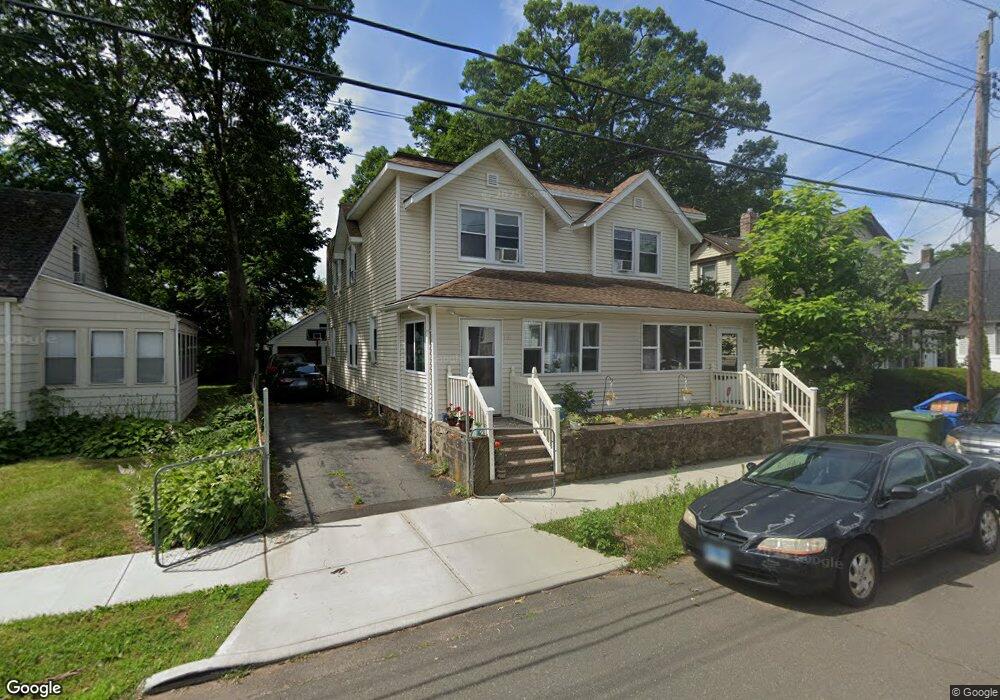
About This Home
This home is located at 110 1st St, Hamden, CT 06514 and is currently estimated at $394,941, approximately $151 per square foot. 110 1st St is a home located in New Haven County with nearby schools including Church Street School, Hamden Middle School, and Hamden High School.
Ownership History
Date
Name
Owned For
Owner Type
Purchase Details
Closed on
Nov 3, 2004
Sold by
Etter Barbara L
Bought by
Vergara Waldo and Dejesus Cheryl
Current Estimated Value
Home Financials for this Owner
Home Financials are based on the most recent Mortgage that was taken out on this home.
Original Mortgage
$42,400
Outstanding Balance
$20,914
Interest Rate
5.71%
Estimated Equity
$374,027
Create a Home Valuation Report for This Property
The Home Valuation Report is an in-depth analysis detailing your home's value as well as a comparison with similar homes in the area
Home Values in the Area
Average Home Value in this Area
Purchase History
| Date | Buyer | Sale Price | Title Company |
|---|---|---|---|
| Vergara Waldo | $35,340 | -- | |
| Vergara Waldo | $176,659 | -- |
Source: Public Records
Mortgage History
| Date | Status | Borrower | Loan Amount |
|---|---|---|---|
| Open | Vergara Waldo | $42,400 | |
| Open | Vergara Waldo | $169,600 |
Source: Public Records
Tax History
| Year | Tax Paid | Tax Assessment Tax Assessment Total Assessment is a certain percentage of the fair market value that is determined by local assessors to be the total taxable value of land and additions on the property. | Land | Improvement |
|---|---|---|---|---|
| 2025 | $11,004 | $212,100 | $39,550 | $172,550 |
| 2024 | $7,525 | $135,310 | $25,200 | $110,110 |
| 2023 | $6,804 | $120,680 | $25,200 | $95,480 |
| 2022 | $6,695 | $120,680 | $25,200 | $95,480 |
| 2021 | $6,328 | $120,680 | $25,200 | $95,480 |
| 2020 | $5,895 | $113,400 | $28,000 | $85,400 |
| 2019 | $5,541 | $113,400 | $28,000 | $85,400 |
| 2018 | $5,439 | $113,400 | $28,000 | $85,400 |
| 2017 | $5,132 | $113,400 | $28,000 | $85,400 |
| 2016 | $5,144 | $113,400 | $28,000 | $85,400 |
| 2015 | $5,195 | $127,120 | $44,030 | $83,090 |
| 2014 | $5,076 | $127,120 | $44,030 | $83,090 |
Source: Public Records
Map
Nearby Homes
- 98 1st St
- 84 2nd St
- 59 Pine St
- 26 4th St
- 32 Sunset Rd
- 23 Notkins St
- 82 Helen St
- 22 Helen St
- 255 Pine Rock Ave Unit 8
- 48 Rockwood Rd
- 304 Pine Rock Ave Unit C2
- 21 Westerfield Rd
- 89 Glenbrook Ave
- 63 Gorham Ave
- 118 Cherry Ann St
- 95 Elmer Ave
- 48 Alling St
- 38 Saint Mary St
- 33 Westview St
- 484 Pine Rock Ave
Your Personal Tour Guide
Ask me questions while you tour the home.