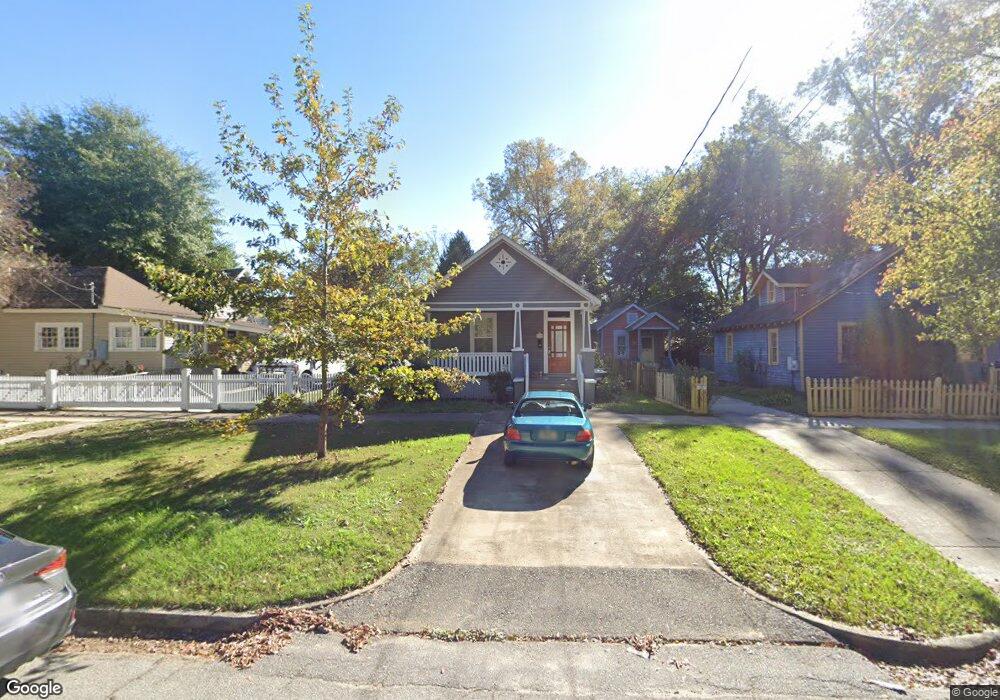
110 5th St Columbus, GA 31901
Downtown Columbus NeighborhoodEstimated Value: $232,645 - $316,000
2
Beds
2
Baths
1,358
Sq Ft
$203/Sq Ft
Est. Value
About This Home
This home is located at 110 5th St, Columbus, GA 31901 and is currently estimated at $275,411, approximately $202 per square foot. 110 5th St is a home located in Muscogee County with nearby schools including Downtown Elementary Magnet Academy, Davis Elementary School, and Eddy Middle School.
Ownership History
Date
Name
Owned For
Owner Type
Purchase Details
Closed on
Sep 29, 2015
Sold by
Historic District Preserva
Bought by
Ells Julia
Current Estimated Value
Purchase Details
Closed on
Apr 10, 2014
Sold by
Destiny Connections Inc
Bought by
Historic District Preservation
Purchase Details
Closed on
Aug 6, 2012
Sold by
Bank Of America
Bought by
Destiny Connections Inc
Purchase Details
Closed on
Dec 6, 2011
Sold by
Kearse Vickie
Bought by
Bank Of America
Create a Home Valuation Report for This Property
The Home Valuation Report is an in-depth analysis detailing your home's value as well as a comparison with similar homes in the area
Home Values in the Area
Average Home Value in this Area
Purchase History
| Date | Buyer | Sale Price | Title Company |
|---|---|---|---|
| Ells Julia | $13,142 | -- | |
| Historic District Preservation | $2,500 | -- | |
| Historic District Preservation | $1,000 | -- | |
| Destiny Connections Inc | -- | -- | |
| Bank Of America | $21,600 | -- |
Source: Public Records
Tax History Compared to Growth
Tax History
| Year | Tax Paid | Tax Assessment Tax Assessment Total Assessment is a certain percentage of the fair market value that is determined by local assessors to be the total taxable value of land and additions on the property. | Land | Improvement |
|---|---|---|---|---|
| 2025 | $1,426 | $85,956 | $16,932 | $69,024 |
| 2024 | $1,425 | $85,956 | $16,932 | $69,024 |
| 2023 | $740 | $85,956 | $16,932 | $69,024 |
| 2022 | $1,486 | $68,996 | $6,900 | $62,096 |
| 2021 | $1,479 | $57,416 | $6,900 | $50,516 |
| 2020 | $1,480 | $57,416 | $6,900 | $50,516 |
| 2019 | $1,486 | $57,416 | $6,900 | $50,516 |
| 2018 | $1,486 | $57,416 | $6,900 | $50,516 |
| 2017 | $1,493 | $49,624 | $6,900 | $42,724 |
| 2016 | $217 | $5,257 | $346 | $4,911 |
| 2015 | $23 | $1,400 | $1,076 | $324 |
| 2014 | $213 | $12,902 | $1,076 | $11,826 |
| 2013 | -- | $12,902 | $1,076 | $11,826 |
Source: Public Records
Map
Nearby Homes
- 437 2nd Ave
- 511 2nd Ave
- 508 3rd Ave
- 600 Broadway
- 215 7th St
- 731 2nd Ave
- 731 Broadway
- 804 2nd Ave
- 816 2nd Ave
- 820 2nd Ave
- 516 Seale Rd
- 1204 1st Ave Unit 303
- 303 Seale Rd
- 304 11th St S
- 1022 Knowles Rd
- 1201 Front Ave Unit 514
- 1201 Front Ave Unit 203
- 1201 Front Ave Unit 222
- 1201 Front Ave
- 1201 Front Ave Unit 507