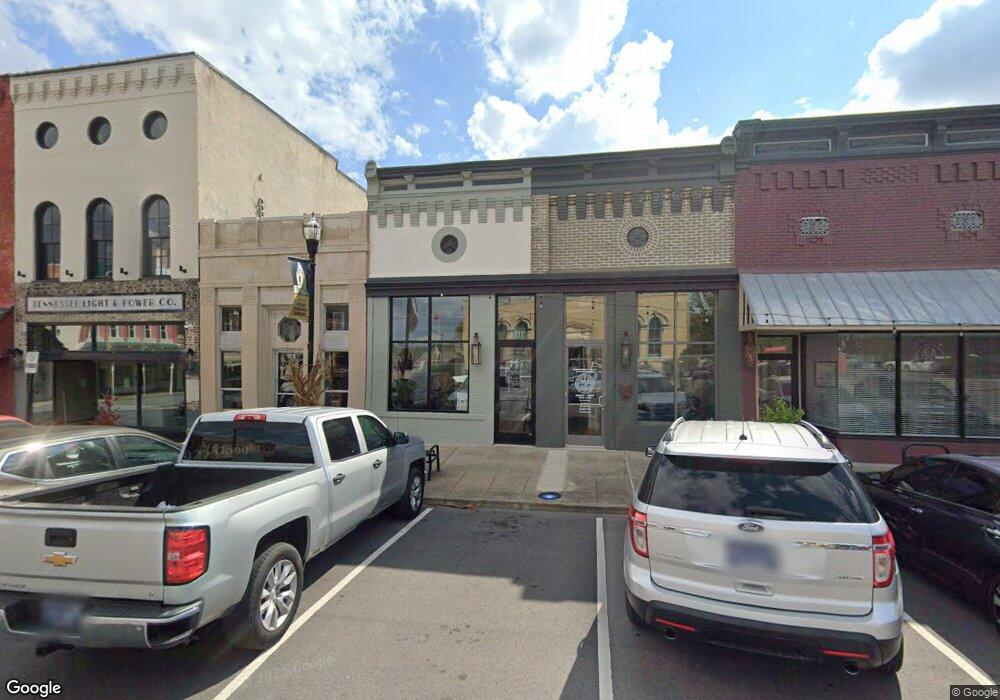
110 6th Ave Springfield, TN 37172
Estimated Value: $95,768
Studio
1
Bath
2,002
Sq Ft
$48/Sq Ft
Est. Value
About This Home
This home is located at 110 6th Ave, Springfield, TN 37172 and is currently estimated at $95,768, approximately $47 per square foot. 110 6th Ave is a home located in Robertson County with nearby schools including Cheatham Park Elementary School, Westside Elementary School, and Innovation Academy.
Ownership History
Date
Name
Owned For
Owner Type
Purchase Details
Closed on
Mar 31, 2020
Sold by
Thompson Whitney Lee
Bought by
Venture 24 Llc
Current Estimated Value
Purchase Details
Closed on
Aug 31, 2017
Sold by
Wilks Martha J
Bought by
Thompson Whitney Lee
Purchase Details
Closed on
Aug 19, 1992
Bought by
Wilks Martha J
Purchase Details
Closed on
Jul 10, 1991
Bought by
Wilkison Florence M
Purchase Details
Closed on
Jun 22, 1989
Bought by
Wilkison John E
Purchase Details
Closed on
Apr 1, 1989
Purchase Details
Closed on
Mar 25, 1966
Bought by
Wilkison J E
Purchase Details
Closed on
Apr 25, 1940
Purchase Details
Closed on
Apr 7, 1937
Create a Home Valuation Report for This Property
The Home Valuation Report is an in-depth analysis detailing your home's value as well as a comparison with similar homes in the area
Home Values in the Area
Average Home Value in this Area
Purchase History
| Date | Buyer | Sale Price | Title Company |
|---|---|---|---|
| Venture 24 Llc | $65,000 | None Available | |
| Thompson Whitney Lee | $108,000 | Tennessee Title Services Llc | |
| Wilks Martha J | $39,500 | -- | |
| Wilkison Florence M | -- | -- | |
| Wilkison John E | -- | -- | |
| -- | $10,000 | -- | |
| Wilkison J E | -- | -- | |
| -- | -- | -- | |
| -- | -- | -- |
Source: Public Records
Tax History
| Year | Tax Paid | Tax Assessment Tax Assessment Total Assessment is a certain percentage of the fair market value that is determined by local assessors to be the total taxable value of land and additions on the property. | Land | Improvement |
|---|---|---|---|---|
| 2025 | -- | $25,880 | $12,480 | $13,400 |
| 2024 | -- | $25,880 | $12,480 | $13,400 |
| 2023 | $649 | $25,880 | $12,480 | $13,400 |
| 2022 | $559 | $15,320 | $4,400 | $10,920 |
| 2021 | $687 | $15,320 | $4,400 | $10,920 |
| 2020 | $1,661 | $18,840 | $4,400 | $14,440 |
| 2019 | $49,973 | $45,520 | $6,680 | $38,840 |
| 2018 | $1,661 | $45,520 | $6,680 | $38,840 |
| 2017 | $1,620 | $37,800 | $6,000 | $31,800 |
| 2016 | $1,620 | $37,800 | $6,000 | $31,800 |
| 2015 | $1,572 | $37,800 | $6,000 | $31,800 |
| 2014 | $1,572 | $37,800 | $6,000 | $31,800 |
Source: Public Records
Map
Nearby Homes
Your Personal Tour Guide
Ask me questions while you tour the home.