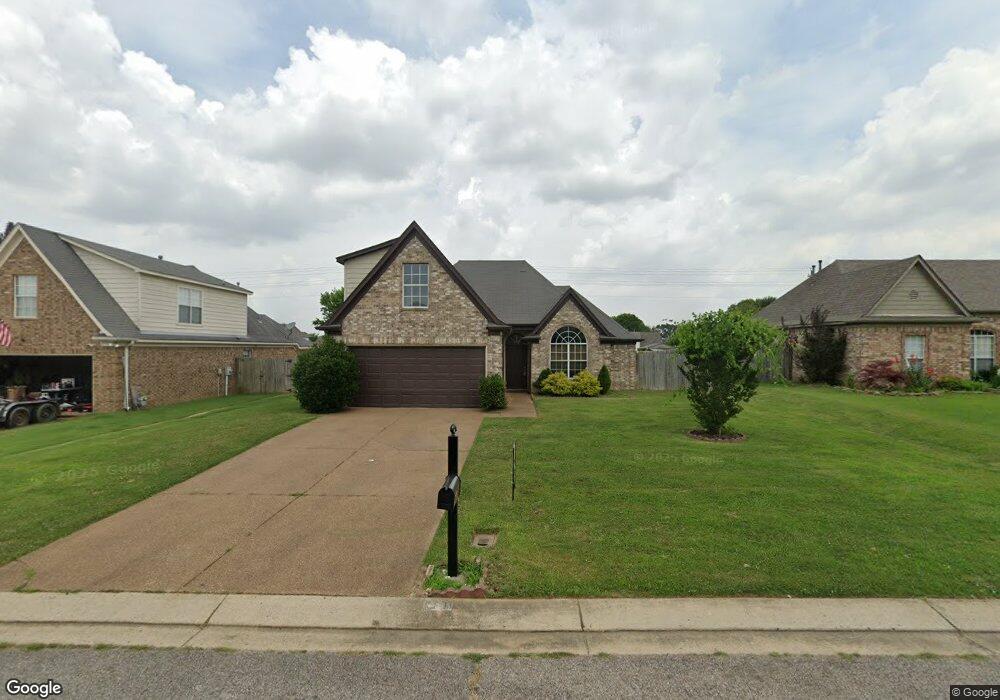
110 Abbey Rd Oakland, TN 38060
Estimated Value: $282,000 - $292,000
4
Beds
2
Baths
1,870
Sq Ft
$153/Sq Ft
Est. Value
About This Home
This home is located at 110 Abbey Rd, Oakland, TN 38060 and is currently estimated at $287,040, approximately $153 per square foot. 110 Abbey Rd is a home located in Fayette County with nearby schools including Oakland Elementary School, West Junior High School, and Fayette Ware Comprehensive High School.
Ownership History
Date
Name
Owned For
Owner Type
Purchase Details
Closed on
Feb 19, 2021
Sold by
Deleon Johanna and Perez Walin Nouel
Bought by
Perez Johanna B and Perez Walin N
Current Estimated Value
Home Financials for this Owner
Home Financials are based on the most recent Mortgage that was taken out on this home.
Original Mortgage
$134,000
Outstanding Balance
$98,640
Interest Rate
2.7%
Mortgage Type
New Conventional
Estimated Equity
$188,400
Purchase Details
Closed on
Jun 6, 2007
Sold by
Riverbend Building Corp
Bought by
Deleon Johanna
Home Financials for this Owner
Home Financials are based on the most recent Mortgage that was taken out on this home.
Original Mortgage
$164,900
Interest Rate
6.16%
Mortgage Type
New Conventional
Purchase Details
Closed on
Jun 23, 2006
Bought by
Riverbend Building Corp Inc
Purchase Details
Closed on
Nov 15, 2005
Bought by
Ultra Homes Llc
Create a Home Valuation Report for This Property
The Home Valuation Report is an in-depth analysis detailing your home's value as well as a comparison with similar homes in the area
Home Values in the Area
Average Home Value in this Area
Purchase History
| Date | Buyer | Sale Price | Title Company |
|---|---|---|---|
| Perez Johanna B | -- | Accommodation | |
| Deleon Johanna | $164,900 | -- | |
| Deleon Johanna | $164,900 | -- | |
| Riverbend Building Corp Inc | $231,000 | -- | |
| Ultra Homes Llc | $660,000 | -- |
Source: Public Records
Mortgage History
| Date | Status | Borrower | Loan Amount |
|---|---|---|---|
| Open | Perez Johanna B | $134,000 | |
| Closed | Deleon Johanna | $164,900 |
Source: Public Records
Tax History Compared to Growth
Tax History
| Year | Tax Paid | Tax Assessment Tax Assessment Total Assessment is a certain percentage of the fair market value that is determined by local assessors to be the total taxable value of land and additions on the property. | Land | Improvement |
|---|---|---|---|---|
| 2024 | $658 | $51,950 | $9,500 | $42,450 |
| 2023 | $1,342 | $51,950 | $0 | $0 |
| 2022 | $890 | $51,950 | $9,500 | $42,450 |
| 2021 | $890 | $51,950 | $9,500 | $42,450 |
| 2020 | $591 | $51,950 | $9,500 | $42,450 |
| 2019 | $795 | $39,175 | $7,500 | $31,675 |
| 2018 | $818 | $39,175 | $7,500 | $31,675 |
| 2017 | $697 | $39,175 | $7,500 | $31,675 |
| 2016 | $692 | $36,375 | $7,500 | $28,875 |
| 2015 | $692 | $36,375 | $7,500 | $28,875 |
| 2014 | $692 | $36,375 | $7,500 | $28,875 |
Source: Public Records
Map
Nearby Homes
- 30 Mossy Springs Cove
- 245 Mossy Springs Dr
- 70 Valleyview Ln
- 245 Susanne Dr
- 0 Mcfadden Dr Unit 10209515
- 270 Oak St
- 165 Susanne Dr
- 45 Sadie Cove
- 40 Windy Cove
- 24.17 AC Tennessee 194
- 000 Hwy 64
- 0 Mcauley St Unit 10186597
- 25 Breezy Loop
- 170 Oakland Ridge Cove
- 40 Gracie Cove
- 65 Cleer Ave
- 265 Kipling Dr
- 250 Kipling Dr
- 50 High St
- 215 Hughetta St S
- 100 Abbey Rd
- 90 Abbey Rd
- 120 Abbey Rd
- 20 Strawberry Field Cove
- 115 Abbey Rd
- 80 Abbey Rd
- 25 Strawberry Field Cove
- 130 Abbey Rd
- 70 Abbey Rd
- 125 Abbey Rd
- 75 Abbey Rd
- 40 Spring Valley Dr
- 30 Spring Valley Dr
- 30 Spring Valley Dr Unit 2314481-59551
- 40 Strawberry Field Cove
- 20 Spring Valley Dr
- 20 Spring Valley Dr Unit 2311878-59551
- 35 Strawberry Field Cove
- 60 Abbey Rd
- 55 Abbey Rd