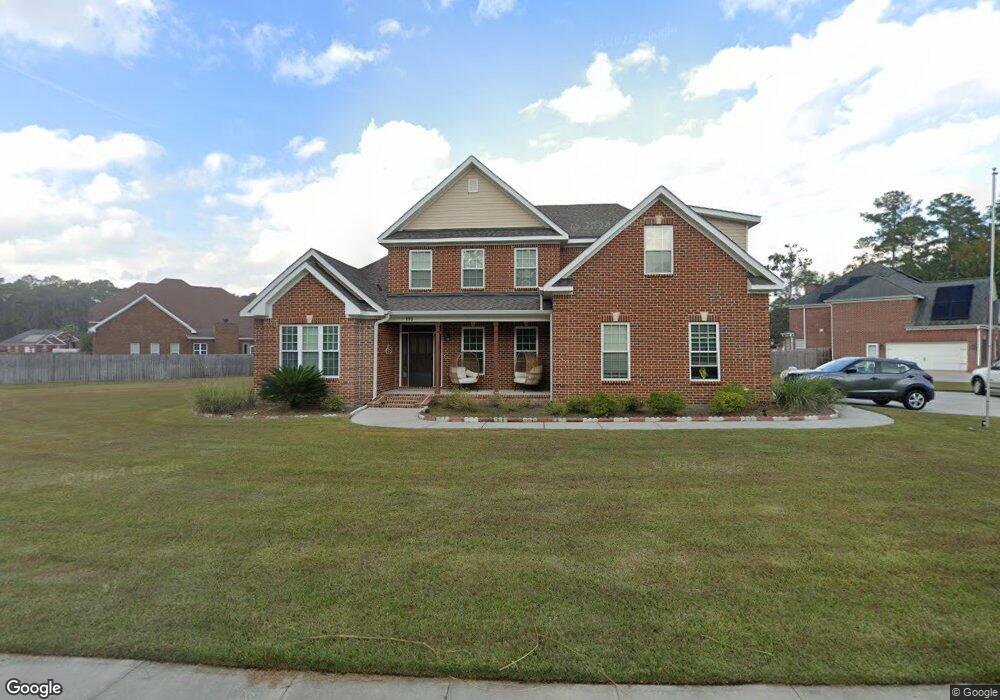
110 Ali Ave Hinesville, GA 31313
Estimated Value: $433,000 - $475,000
5
Beds
3
Baths
3,054
Sq Ft
$148/Sq Ft
Est. Value
About This Home
This home is located at 110 Ali Ave, Hinesville, GA 31313 and is currently estimated at $451,732, approximately $147 per square foot. 110 Ali Ave is a home located in Liberty County with nearby schools including Joseph Martin Elementary School, Midway Middle School, and Liberty County High School.
Ownership History
Date
Name
Owned For
Owner Type
Purchase Details
Closed on
Jun 6, 2017
Sold by
Kc Brothers Const Co Llc
Bought by
Bivins Audrey
Current Estimated Value
Home Financials for this Owner
Home Financials are based on the most recent Mortgage that was taken out on this home.
Original Mortgage
$337,095
Outstanding Balance
$279,776
Interest Rate
3.94%
Estimated Equity
$171,956
Purchase Details
Closed on
Jan 7, 2015
Sold by
Kc Custom Homes & Remode
Bought by
Kc Brothers Construction Co Ll
Purchase Details
Closed on
Jan 31, 2012
Purchase Details
Closed on
Sep 6, 2011
Sold by
Wln Development Co
Bought by
The Heritage Bank
Create a Home Valuation Report for This Property
The Home Valuation Report is an in-depth analysis detailing your home's value as well as a comparison with similar homes in the area
Home Values in the Area
Average Home Value in this Area
Purchase History
| Date | Buyer | Sale Price | Title Company |
|---|---|---|---|
| Bivins Audrey | $330,000 | -- | |
| Kc Brothers Construction Co Ll | -- | -- | |
| -- | $245,000 | -- | |
| Kc Custom Homes & Remodeling Llc | $245,000 | -- | |
| The Heritage Bank | -- | -- |
Source: Public Records
Mortgage History
| Date | Status | Borrower | Loan Amount |
|---|---|---|---|
| Open | Bivins Audrey | $337,095 |
Source: Public Records
Tax History Compared to Growth
Tax History
| Year | Tax Paid | Tax Assessment Tax Assessment Total Assessment is a certain percentage of the fair market value that is determined by local assessors to be the total taxable value of land and additions on the property. | Land | Improvement |
|---|---|---|---|---|
| 2024 | $6,718 | $201,492 | $26,000 | $175,492 |
| 2023 | $6,718 | $180,686 | $26,000 | $154,686 |
| 2022 | $5,652 | $152,234 | $26,000 | $126,234 |
| 2021 | $5,586 | $139,589 | $26,000 | $113,589 |
| 2020 | $5,497 | $132,076 | $22,000 | $110,076 |
| 2019 | $5,363 | $132,156 | $22,000 | $110,156 |
| 2018 | $5,256 | $132,156 | $22,000 | $110,156 |
| 2017 | $3,574 | $108,536 | $22,000 | $86,536 |
| 2016 | $491 | $11,000 | $11,000 | $0 |
| 2015 | $497 | $11,000 | $11,000 | $0 |
| 2014 | $497 | $11,000 | $11,000 | $0 |
| 2013 | -- | $11,000 | $11,000 | $0 |
Source: Public Records
Map
Nearby Homes