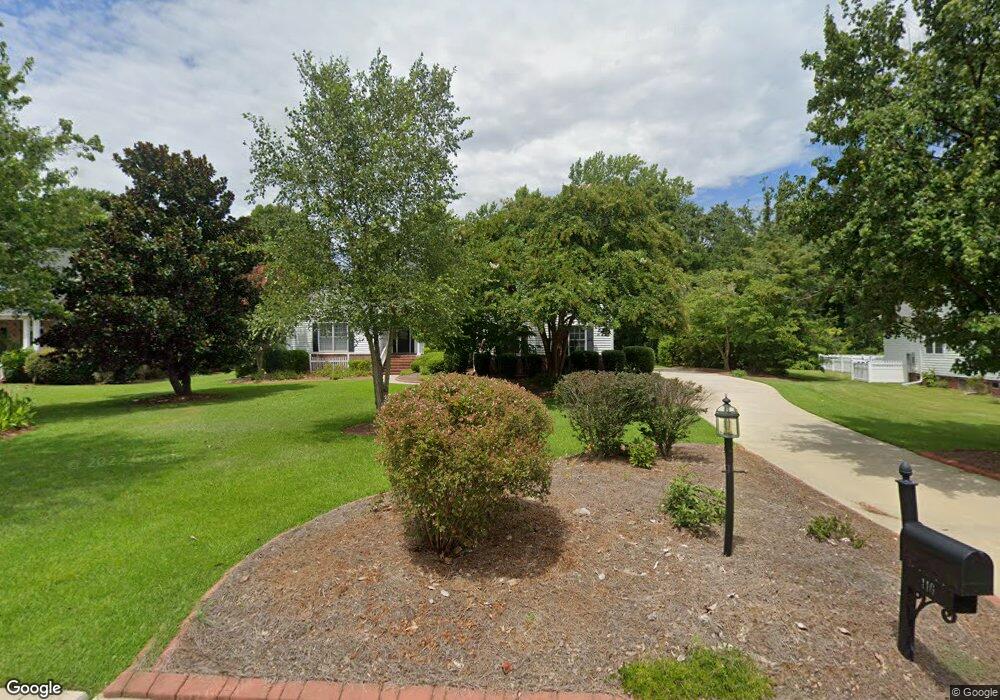
110 Arbon Ln New Bern, NC 28562
Estimated Value: $524,000 - $624,000
5
Beds
3
Baths
3,052
Sq Ft
$192/Sq Ft
Est. Value
About This Home
This home is located at 110 Arbon Ln, New Bern, NC 28562 and is currently estimated at $585,144, approximately $191 per square foot. 110 Arbon Ln is a home located in Craven County with nearby schools including Creekside Elementary School, Grover C. Fields Middle School, and New Bern High School.
Ownership History
Date
Name
Owned For
Owner Type
Purchase Details
Closed on
May 12, 2022
Sold by
Watson Thomas W and Watson Ellen O
Bought by
Hansell Brian C and Hansell Ashley A
Current Estimated Value
Home Financials for this Owner
Home Financials are based on the most recent Mortgage that was taken out on this home.
Original Mortgage
$330,000
Outstanding Balance
$313,633
Interest Rate
5.3%
Mortgage Type
VA
Estimated Equity
$271,511
Purchase Details
Closed on
Jun 22, 1999
Sold by
Weyerhaeuser Company
Bought by
Watson Thomas W and Watson Ellen O
Create a Home Valuation Report for This Property
The Home Valuation Report is an in-depth analysis detailing your home's value as well as a comparison with similar homes in the area
Home Values in the Area
Average Home Value in this Area
Purchase History
| Date | Buyer | Sale Price | Title Company |
|---|---|---|---|
| Hansell Brian C | -- | White & Allen Pa | |
| Watson Thomas W | $55,000 | -- |
Source: Public Records
Mortgage History
| Date | Status | Borrower | Loan Amount |
|---|---|---|---|
| Open | Hansell Brian C | $330,000 |
Source: Public Records
Tax History Compared to Growth
Tax History
| Year | Tax Paid | Tax Assessment Tax Assessment Total Assessment is a certain percentage of the fair market value that is determined by local assessors to be the total taxable value of land and additions on the property. | Land | Improvement |
|---|---|---|---|---|
| 2025 | $4,167 | $490,580 | $50,000 | $440,580 |
| 2024 | $4,167 | $490,580 | $50,000 | $440,580 |
| 2023 | $4,106 | $490,580 | $50,000 | $440,580 |
| 2022 | $3,726 | $351,740 | $50,000 | $301,740 |
| 2021 | $3,726 | $351,740 | $50,000 | $301,740 |
| 2020 | $3,387 | $351,740 | $50,000 | $301,740 |
| 2019 | $3,689 | $351,740 | $50,000 | $301,740 |
| 2018 | $0 | $351,740 | $50,000 | $301,740 |
| 2017 | $3,551 | $335,340 | $50,000 | $285,340 |
| 2016 | $3,387 | $393,870 | $90,000 | $303,870 |
| 2015 | $3,492 | $393,870 | $90,000 | $303,870 |
| 2014 | -- | $393,870 | $90,000 | $303,870 |
Source: Public Records
Map
Nearby Homes