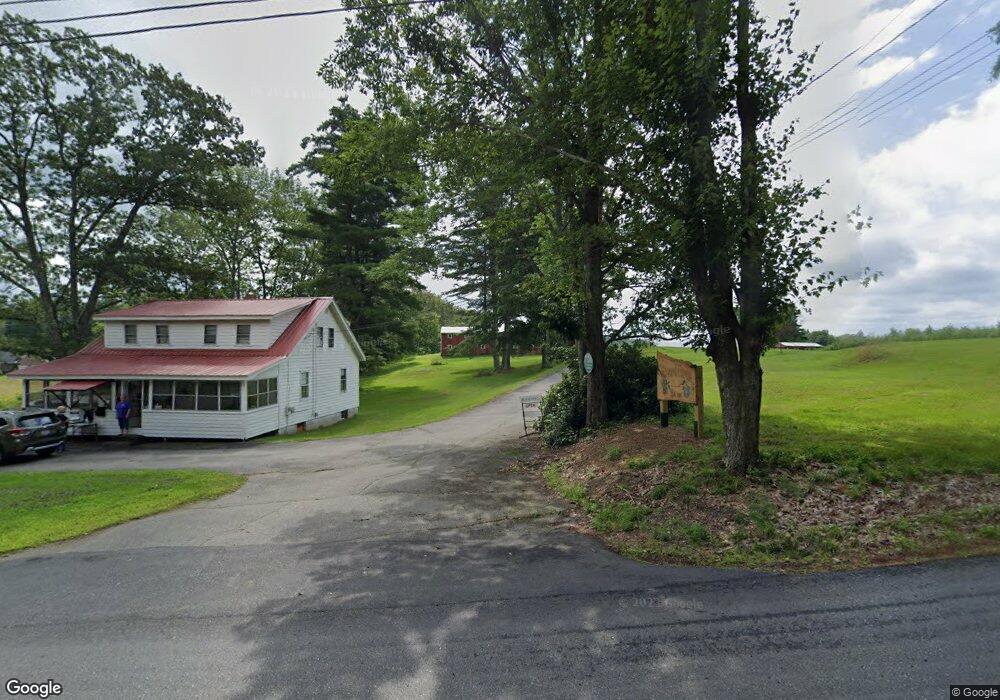
110 Blanchard Rd Springvale, ME 04083
Estimated Value: $310,000 - $424,000
5
Beds
1
Bath
1,792
Sq Ft
$196/Sq Ft
Est. Value
About This Home
This home is located at 110 Blanchard Rd, Springvale, ME 04083 and is currently estimated at $351,599, approximately $196 per square foot. 110 Blanchard Rd is a home located in York County.
Ownership History
Date
Name
Owned For
Owner Type
Purchase Details
Closed on
Apr 4, 2025
Sold by
Rivard Farm Llc
Bought by
Jones Joseph C and Jones Michelle C
Current Estimated Value
Home Financials for this Owner
Home Financials are based on the most recent Mortgage that was taken out on this home.
Original Mortgage
$230,000
Outstanding Balance
$228,593
Interest Rate
6.76%
Mortgage Type
Commercial
Estimated Equity
$123,006
Purchase Details
Closed on
Apr 29, 2024
Sold by
Gerard A Rivard Ft and Martin
Bought by
Rivard Farm Llc
Create a Home Valuation Report for This Property
The Home Valuation Report is an in-depth analysis detailing your home's value as well as a comparison with similar homes in the area
Home Values in the Area
Average Home Value in this Area
Purchase History
| Date | Buyer | Sale Price | Title Company |
|---|---|---|---|
| Jones Joseph C | $325,000 | None Available | |
| Jones Joseph C | $325,000 | None Available | |
| Jones Joseph C | $325,000 | None Available | |
| Rivard Farm Llc | -- | None Available | |
| Rivard Farm Llc | -- | None Available | |
| Rivard Farm Llc | -- | None Available |
Source: Public Records
Mortgage History
| Date | Status | Borrower | Loan Amount |
|---|---|---|---|
| Open | Jones Joseph C | $230,000 | |
| Closed | Jones Joseph C | $230,000 |
Source: Public Records
Tax History Compared to Growth
Tax History
| Year | Tax Paid | Tax Assessment Tax Assessment Total Assessment is a certain percentage of the fair market value that is determined by local assessors to be the total taxable value of land and additions on the property. | Land | Improvement |
|---|---|---|---|---|
| 2025 | $4,164 | $243,500 | $43,600 | $199,900 |
| 2024 | $3,930 | $243,500 | $43,600 | $199,900 |
| 2023 | $3,653 | $241,300 | $43,600 | $197,700 |
| 2022 | $3,571 | $241,300 | $43,600 | $197,700 |
| 2021 | $3,525 | $193,900 | $43,600 | $150,300 |
| 2020 | $3,574 | $177,300 | $43,600 | $133,700 |
| 2019 | $3,277 | $158,300 | $43,600 | $114,700 |
| 2018 | $3,052 | $148,900 | $39,000 | $109,900 |
| 2017 | $2,941 | $141,800 | $39,000 | $102,800 |
| 2016 | $2,945 | $129,500 | $39,200 | $90,300 |
Source: Public Records
Map
Nearby Homes