Estimated Value: $224,000 - $284,000
3
Beds
1
Bath
1,354
Sq Ft
$180/Sq Ft
Est. Value
About This Home
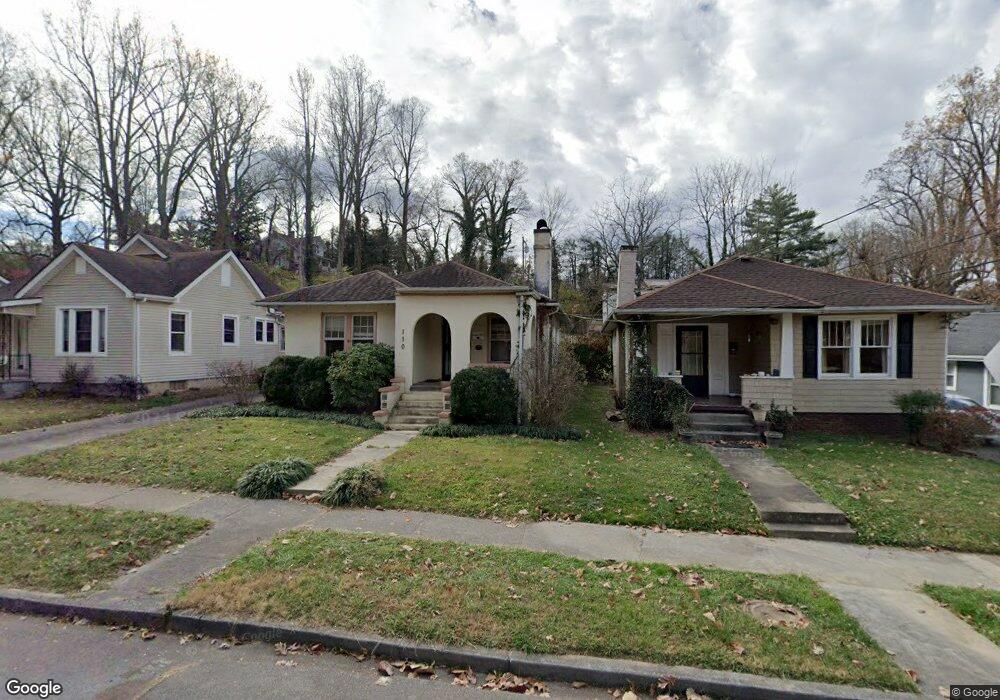
This home is located at 110 Boyd St, Johnson City, TN 37604 and is currently estimated at $243,656, approximately $179 per square foot. 110 Boyd St is a home located in Washington County with nearby schools including South Side Elementary School, Liberty Bell Middle School, and Indian Trail Middle School.
Ownership History
Date
Name
Owned For
Owner Type
Purchase Details
Closed on
Oct 19, 2021
Sold by
Mcknight Lawrence C and Mcknight Kathy F
Bought by
Mcknight Catherine Lindsay and Mcknight Mary Elizabeth
Current Estimated Value
Purchase Details
Closed on
Feb 2, 2007
Sold by
Tickle John C
Bought by
Mcknight Lawrence C
Purchase Details
Closed on
Jun 24, 2002
Sold by
Fogarty Edward L
Bought by
Tickle John C
Home Financials for this Owner
Home Financials are based on the most recent Mortgage that was taken out on this home.
Original Mortgage
$52,000
Interest Rate
6.79%
Purchase Details
Closed on
Jan 12, 1998
Sold by
Zannis Pete and Zannis Kathy
Bought by
Fogarty Edward L and Fogarty Elizabe
Purchase Details
Closed on
Oct 25, 1995
Sold by
Jones Douglas P and Jones Donna S
Bought by
Zannis Pete
Purchase Details
Closed on
Apr 5, 1988
Bought by
Jones Douglas P and Jones Donna S
Create a Home Valuation Report for This Property
The Home Valuation Report is an in-depth analysis detailing your home's value as well as a comparison with similar homes in the area
Home Values in the Area
Average Home Value in this Area
Purchase History
| Date | Buyer | Sale Price | Title Company |
|---|---|---|---|
| Mcknight Catherine Lindsay | -- | None Available | |
| Mcknight Lawrence C | $105,000 | -- | |
| Tickle John C | $65,000 | -- | |
| Fogarty Edward L | $66,000 | -- | |
| Zannis Pete | $41,302 | -- | |
| Jones Douglas P | $38,800 | -- |
Source: Public Records
Mortgage History
| Date | Status | Borrower | Loan Amount |
|---|---|---|---|
| Previous Owner | Jones Douglas P | $52,000 | |
| Previous Owner | Jones Douglas P | $9,700 |
Source: Public Records
Tax History Compared to Growth
Tax History
| Year | Tax Paid | Tax Assessment Tax Assessment Total Assessment is a certain percentage of the fair market value that is determined by local assessors to be the total taxable value of land and additions on the property. | Land | Improvement |
|---|---|---|---|---|
| 2024 | $835 | $48,825 | $5,675 | $43,150 |
| 2022 | $600 | $27,900 | $2,700 | $25,200 |
| 2021 | $1,083 | $27,900 | $2,700 | $25,200 |
| 2020 | $1,077 | $27,900 | $2,700 | $25,200 |
| 2019 | $663 | $27,900 | $2,700 | $25,200 |
| 2018 | $1,189 | $27,850 | $2,700 | $25,150 |
| 2017 | $1,189 | $27,850 | $2,700 | $25,150 |
| 2016 | $1,184 | $27,850 | $2,700 | $25,150 |
| 2015 | $1,072 | $27,850 | $2,700 | $25,150 |
| 2014 | $1,003 | $27,850 | $2,700 | $25,150 |
Source: Public Records
Map
Nearby Homes
- 1125 Cedar Place
- 1503 Virginia St
- 433 W Poplar St
- 707 W Maple St
- 1504 Southwest Ave
- 405 W Magnolia Ave
- 403 W Poplar St
- 300 Peach Blossom Ct
- 904 Echo Ln
- 801 Ridgecrest Rd
- 313 Lamont St
- 1007 Spring St
- 112 W Chestnut St
- 102 W Locust St
- 116 Tipton St Unit 209
- 807 Jared Dr Unit 2
- 302 Wilson Ave
- 427 Hamilton St
- 1307 College Heights Rd
- 617 Lamont St