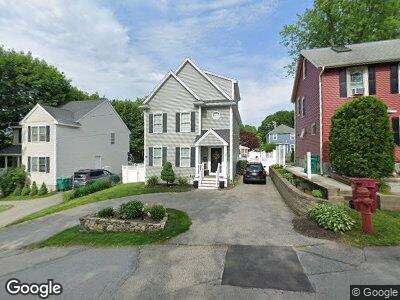
110 Burnside St Lowell, MA 01851
Highlands NeighborhoodEstimated Value: $412,000 - $704,000
3
Beds
2
Baths
2,756
Sq Ft
$220/Sq Ft
Est. Value
About This Home
This home is located at 110 Burnside St, Lowell, MA 01851 and is currently estimated at $605,573, approximately $219 per square foot. 110 Burnside St is a home located in Middlesex County with nearby schools including Charles W. Morey Elementary School, Abraham Lincoln Elementary School, and Dr. Gertrude Bailey Elementary School.
Ownership History
Date
Name
Owned For
Owner Type
Purchase Details
Closed on
Jun 30, 2008
Sold by
Guthrie Richard
Bought by
Aylward James and Aylward Jennifer
Current Estimated Value
Home Financials for this Owner
Home Financials are based on the most recent Mortgage that was taken out on this home.
Original Mortgage
$288,000
Interest Rate
6.07%
Mortgage Type
Purchase Money Mortgage
Create a Home Valuation Report for This Property
The Home Valuation Report is an in-depth analysis detailing your home's value as well as a comparison with similar homes in the area
Home Values in the Area
Average Home Value in this Area
Purchase History
| Date | Buyer | Sale Price | Title Company |
|---|---|---|---|
| Aylward James | $84,000 | -- | |
| Aylward James | $84,000 | -- |
Source: Public Records
Mortgage History
| Date | Status | Borrower | Loan Amount |
|---|---|---|---|
| Open | Aylward James | $294,000 | |
| Closed | Aylward James | $290,000 | |
| Closed | Aylward James | $288,000 |
Source: Public Records
Tax History Compared to Growth
Tax History
| Year | Tax Paid | Tax Assessment Tax Assessment Total Assessment is a certain percentage of the fair market value that is determined by local assessors to be the total taxable value of land and additions on the property. | Land | Improvement |
|---|---|---|---|---|
| 2025 | $7,654 | $666,700 | $165,600 | $501,100 |
| 2024 | $7,471 | $627,300 | $154,800 | $472,500 |
| 2023 | $7,199 | $579,600 | $134,600 | $445,000 |
| 2022 | $6,935 | $546,500 | $122,400 | $424,100 |
| 2021 | $6,484 | $481,700 | $106,400 | $375,300 |
| 2020 | $6,155 | $460,700 | $100,000 | $360,700 |
| 2019 | $5,918 | $421,500 | $85,000 | $336,500 |
| 2018 | $5,841 | $405,900 | $81,000 | $324,900 |
| 2017 | $5,610 | $376,000 | $73,600 | $302,400 |
| 2016 | $5,361 | $353,600 | $73,600 | $280,000 |
| 2015 | $5,198 | $335,800 | $73,600 | $262,200 |
| 2013 | $4,432 | $295,300 | $77,100 | $218,200 |
Source: Public Records
Map
Nearby Homes
- 97 Livingston Ave
- 21 Florence Ave
- 1311 Middlesex St
- 271 Gibson St
- 305 Pine St Unit 18
- 53 Joffre St
- 30 Caleb St
- 11 Florence Rd
- 17 Morey St
- 35 Morey St
- 1117 Middlesex St
- 342 Stevens St
- 68 Dover St Unit 4
- 293 Pawtucket Blvd Unit 3
- 345 Pawtucket Blvd Unit 5
- 4 Tamarack St
- 96 Grove St
- 311 Pawtucket Blvd Unit 27
- 114 Warwick St
- 118 D St
- 110 Burnside St
- 114 Burnside St
- 104 Burnside St
- 105 Sayles St
- 120 Burnside St
- 98 Burnside St
- 111 Sayles St
- 99 Sayles St
- 115 Sayles St
- 123 Burnside St
- 89 Sayles St
- 119 Sayles St
- 95 Burnside St
- 90 Burnside St
- 25 Fairgrove Ave
- 21 Fairgrove Ave
- 235 Princeton Blvd
- 239 Princeton Blvd
- 31 Fairgrove Ave
- 229 Princeton Blvd