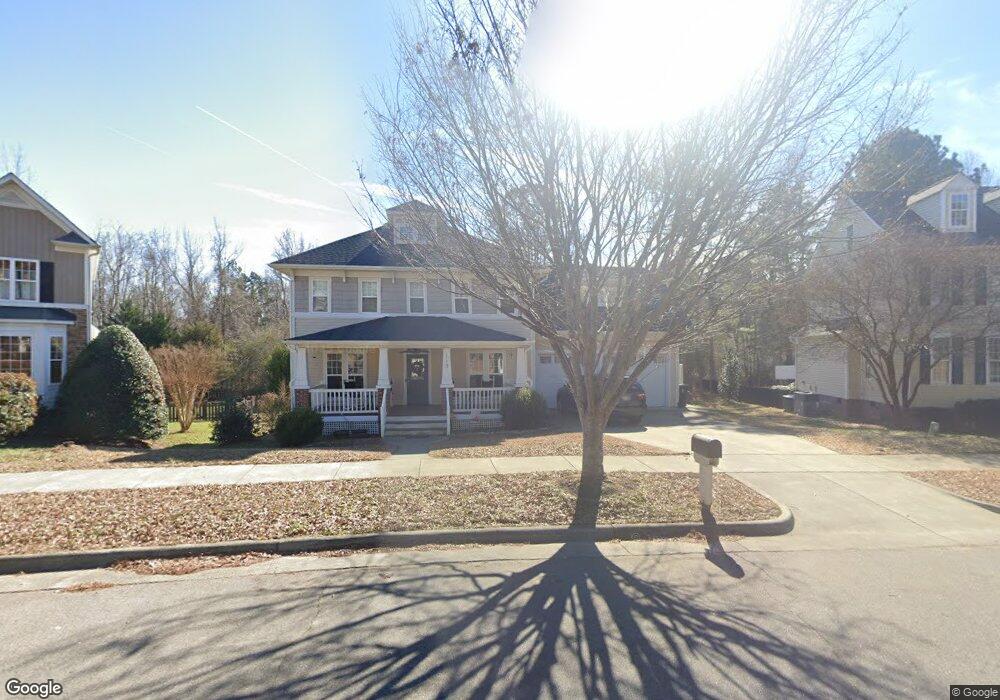
110 Byron Ct Oxford, NC 27565
Estimated Value: $418,879 - $466,000
4
Beds
3
Baths
2,673
Sq Ft
$165/Sq Ft
Est. Value
About This Home
This home is located at 110 Byron Ct, Oxford, NC 27565 and is currently estimated at $440,470, approximately $164 per square foot. 110 Byron Ct is a home located in Granville County with nearby schools including Stovall-Shaw Elementary School, Northern Granville Middle School, and J.F. Webb High School.
Ownership History
Date
Name
Owned For
Owner Type
Purchase Details
Closed on
Mar 16, 2020
Sold by
Meador Vickie L and Meador Richard D
Bought by
Thornton Leslie
Current Estimated Value
Home Financials for this Owner
Home Financials are based on the most recent Mortgage that was taken out on this home.
Original Mortgage
$260,000
Outstanding Balance
$232,559
Interest Rate
4.37%
Mortgage Type
New Conventional
Estimated Equity
$207,911
Purchase Details
Closed on
Dec 12, 2013
Sold by
Herman Barbara S
Bought by
Meadow Vickie L
Home Financials for this Owner
Home Financials are based on the most recent Mortgage that was taken out on this home.
Original Mortgage
$210,400
Interest Rate
4.29%
Mortgage Type
New Conventional
Purchase Details
Closed on
Aug 7, 2006
Sold by
Robuck Homes Triangle Llc
Bought by
Herman Barbara S
Home Financials for this Owner
Home Financials are based on the most recent Mortgage that was taken out on this home.
Original Mortgage
$165,000
Interest Rate
6.68%
Mortgage Type
New Conventional
Create a Home Valuation Report for This Property
The Home Valuation Report is an in-depth analysis detailing your home's value as well as a comparison with similar homes in the area
Purchase History
| Date | Buyer | Sale Price | Title Company |
|---|---|---|---|
| Thornton Leslie | $265,000 | None Available | |
| Meadow Vickie L | $263,000 | None Available | |
| Herman Barbara S | $305,000 | -- |
Source: Public Records
Mortgage History
| Date | Status | Borrower | Loan Amount |
|---|---|---|---|
| Open | Thornton Leslie | $260,000 | |
| Previous Owner | Meadow Vickie L | $210,400 | |
| Previous Owner | Herman Barbara S | $165,000 |
Source: Public Records
Tax History
| Year | Tax Paid | Tax Assessment Tax Assessment Total Assessment is a certain percentage of the fair market value that is determined by local assessors to be the total taxable value of land and additions on the property. | Land | Improvement |
|---|---|---|---|---|
| 2025 | $5,088 | $437,076 | $37,000 | $400,076 |
| 2024 | $5,088 | $437,076 | $37,000 | $400,076 |
| 2023 | $5,086 | $267,048 | $25,000 | $242,048 |
| 2022 | $3,977 | $267,048 | $25,000 | $242,048 |
| 2021 | $3,972 | $267,048 | $25,000 | $242,048 |
| 2020 | $3,972 | $267,048 | $25,000 | $242,048 |
| 2019 | $3,972 | $267,048 | $25,000 | $242,048 |
| 2018 | $3,972 | $282,646 | $37,500 | $245,146 |
| 2016 | $4,030 | $263,793 | $37,500 | $226,293 |
| 2015 | $3,893 | $263,793 | $37,500 | $226,293 |
| 2014 | $3,893 | $263,793 | $37,500 | $226,293 |
| 2013 | -- | $263,793 | $37,500 | $226,293 |
Source: Public Records
Map
Nearby Homes
- 105 Byron Ct
- 102 Kipling Dr
- 107 York Dr
- 201 Kipling Dr
- 203 Kipling Dr
- 3679 Oak Lawn Farm Rd
- 00 Salem Rd
- 104 Woodland Dr
- 201 Hillandale Dr
- 4076 Salem Farms Rd
- 0 College St Unit 10146821
- 602 Williamsboro St
- 300 Forest Rd
- 200 W Westbury Dr
- 100 Maluli Dr
- 505 Forest Rd
- 6609 Clearwater Dr
- 1220 Oxford Loop Rd
- 118 Rectory St
- 112 Rectory St
- 108 Byron Ct
- 112 Byron Ct
- 106 Byron Ct
- 103 Byron Ct
- 103 Byron Ct Unit Lot15
- 114 Byron Ct
- 101 Byron Ct
- 116 Byron Ct
- 104 Byron Ct
- 302 Oxford Park Blvd
- 3735 Salem Rd
- 304 Oxford Park Blvd
- 300 Oxford Park Blvd
- 102 Byron Ct
- 100 Byron Ct
- 206 Oxford Park Blvd
- 209 Oxford Park Blvd
- 103 Oxford Park Blvd
- 103 Oxford Park Blvd Unit 131
- 207 Oxford Park Blvd
Your Personal Tour Guide
Ask me questions while you tour the home.